

hallojulie
In mid-January I laid out the basic rules for managing a Sector BPI model portfolio in this Seeking Alpha article. In this article I’ll update the Carson portfolio as there are now six of the eleven S&P 500 sectors in the over-sold zone. Exactly what is meant by over-sold? In the following table readers will find Bullish Percent Indicator data for the eleven sectors that make up the S&P 500. When the percent of bullish stocks in a particular sector drops to 30% or lower the sector is considered to be over-sold. When the percentage of bullish stocks rise to 70% bullish or higher, the sector is defined as over-bought.
In the following table six sectors (dark green background on left side of table) are over-sold and therefore are recommended for purchase. Investors have a choice of using either Vanguard or iShares ETFs as investment vehicles for the different sectors. I’ve been using Vanguard ETFs with the Carson portfolio.
If cash is in short supply, the sectors are filled based on the over-sold condition. For example, Energy (VDE) has only 8.7% bullish stocks so that sector is filled first.
The raw data for the following information comes from StockCharts.
Sector Bullish Percent Indicators (itawealth.com)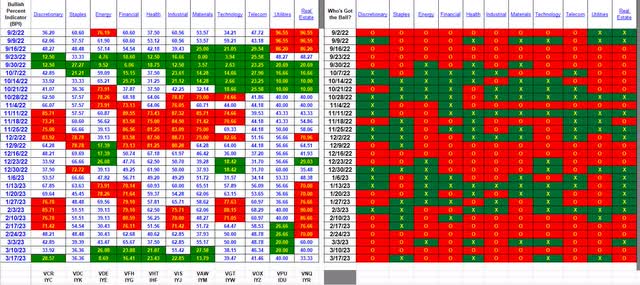
Below is the investment quiver and current holdings for the Carson portfolio.
The third column from the left identifies what percentage to invest in each sector should it be over-sold. That percentage is calculated by taking 0.70 x (a three-year average of the annualized volatility). I’ve adjusted the coefficient to 0.70 so the maximum percentage does not exceed 25% for any given sector.
In the current situation, where six sectors are over-sold, the Maximum Asset Allocation exceeds 100%. In cases such as this one, decisions need to be made by the money manager as to what percentage to invest in each sector. In practice I’ve been filling the sector that is most over-sold first and then working up the chain.
Carson Portfolio (itawealth.com)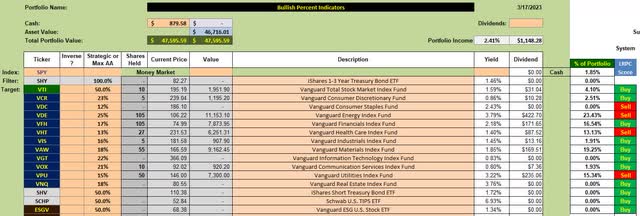
When to sell is a critical as when to buy. When a sector reaches the 70% level or higher the sectors is defined as over-bought. When this happens, place a 3.0% Trailing Stop Loss Order (TSLO) on the sector ETFs. This protects profits and permits the ETF to rise even higher – not an unusual event.
The following screenshot comes from the commercial portfolio tracking software, Investment Account Manager. Over the past 14.5 months the Carson shows a negative 0.44% annualized Internal Rate of Return value while the S&P 500 (SPY) ETF is down an annualized IRR of 13.38%.
While the Carson/Benchmark is positive thus far, it is still much too early to come to any meaningful conclusions. The Carson is still in the hypothesis stage of development. It will require several Buy/Sell cycles before we know if the Sector BPI model is profitable.
Performance Data (itawealth.com)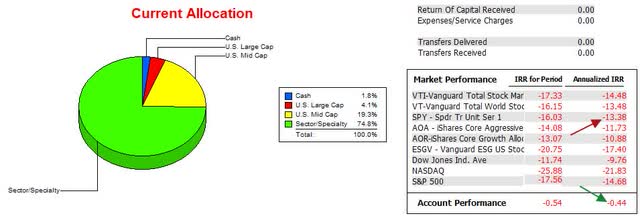
Of the five risk ratios presented below pay most attention to the Sortino, Jensen and Information ratios. The Information Ratio tells us if the portfolio is outperforming the benchmark. I use SPY as the benchmark for the Sector BPI portfolios, of which there are four tracked at itawealth.com.
The negative slope of the Jensen Performance Index or Jensen Alpha indicates just how weak U.S. Equities were in 2022.
Risk Ratio Data (itawealth.com)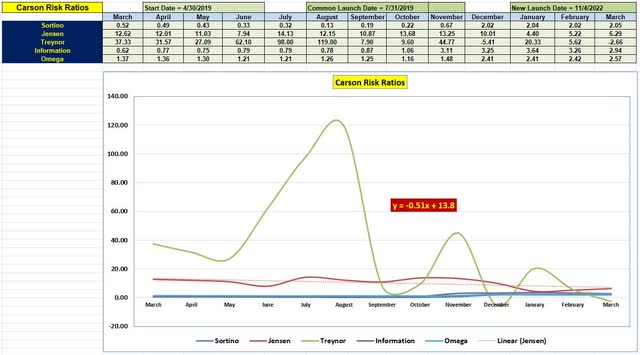
The Sector BPI investing model is a unique portfolio management model. We purchase shares of a particular sector when that sector is over-sold and we sell or rather, place a TSLO on the sector ETF when it reaches the 70% bullish level or higher.
Thus far the model is working as expected based on the hypothesis. Further testing is needed and will be forthcoming. Questions and Comments are always welcome.


")
 (LFABF) Q2 2024 Earnings Call Transcript")


")

 Sport Raises Million, Helps Save Stray Cats")