Guido Mieth/DigitalVision via Getty Images
Editor’s note: Seeking Alpha is proud to welcome Gold Economist as a new contributor. It’s easy to become a Seeking Alpha contributor and earn money for your best investment ideas. Active contributors also get free access to SA Premium. Click here to find out more »
Gold and the Consumer Price Index
Gold is putative as an inflation hedge, as investors buy gold bullion when fearful of future inflation. If this theory holds in practice, then one should be able to front-run the market and profit from buying gold as soon as signs of increased consumer prices emerge. But has this practice worked in previous years? In my view, the current UK consumer price index (CPI) should not be a good indication of gold demand and, by extension, the gold spot price, which will be the focus of this study.
A review of the annual change in CPI and the annual change in the gold price measured in sterling will be reviewed to see if any meaningful correlation can be observed. That’s because this could serve as a forecasting tool that offers windows of opportunity to buy or sell gold coins according to how the UK CPI is behaving. Gold spot price data was sourced from a UK bullion company, Auronum, while UK CPI data was sourced from rate inflation.
Above Target CPI and the Gold Spot Price
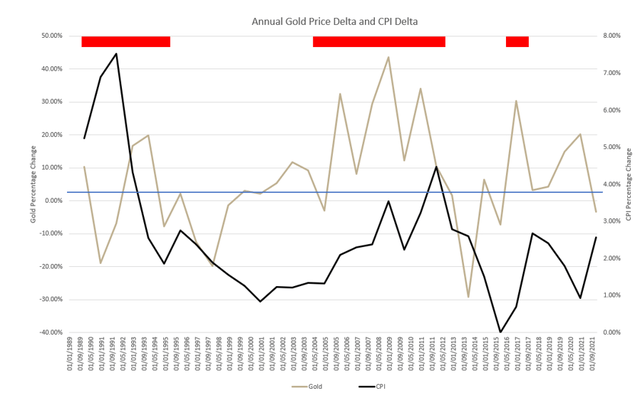
Gold and CPI data (Author’s own excel output)
The above chart shows the annual percentage change in the UK CPI as well as the gold/sterling annual percentage change. The red sections at the top of the chart denote periods of above-target CPI, which was 2%. The first period spanned eight years and resulted in the gold price rallying 10.17% against sterling. Interestingly, gold depreciated at the beginning of the period and again at the end, with annual declines of 18.82% and 12.46%, respectively.
The large gains occurred in the exact middle of the period, which may have been when the inflation problem was the most obvious. In year eight, gold lost 12.46% against sterling, while in year nine it sank an additional 19.71%. I believe that the likely cause underpinning this movement is that the period of above-target inflation was ending, which led to a shift in the perceived prospects of gold bullion.
The next period began in 2004 and ended in 2012, this being a strong period for the gold price as it gained 219.4% against sterling. Gains were evenly spaced throughout the period, with 2004-05 posting a gain of 32.38%. The noteworthy observation is the loss that occurred at the end of this period as gold dove 29.19% from December 2011 to December 2012. CPI was 2.61% in 2012 and then fell below the 2% target in 2013. It seems as if gold underperforms at the end of a period of above-target CPI.
Below Target CPI and the Gold Spot Price
2016 saw a brief period of above-target CPI in the UK, which abated by 2018. Gold gained 7.68% on sterling, but there was no sell-off at the end of the period as had been observed in previous above-target CPI. My view is that this period should be seen as an outlier because gold outperformed other markets given the onset of the global pandemic in 2019. During this period there was no appetite to dump gold despite falling CPI data.
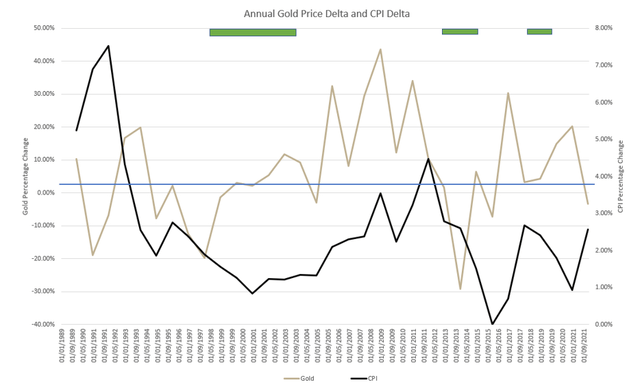
Gold and CPI chart 2 (Author’s own Excel output)
The next chart shows three periods of below-target CPI compared with the gold price performance in terms of sterling. 1998 was the first of six years that saw CPI comfortably below 1.5% annually. This was a positive period for gold, which gained 31.34% against sterling. The only year that saw a loss for UK gold investors was 2003-04, which was the beginning of the period analyzed in the previous section. That period saw strong CPI growth and a twofold increase in the gold price.
Two brief periods of low CPI data occurred after 2013. Each period saw a net gain for gold against sterling. The second period, however, should be omitted from the analysis as it encompasses the onset of the global pandemic. Tabulated below is the performance of gold against sterling with the corresponding UK CPI.
|
Year |
Gold Delta |
CPI Delta |
|
2015 |
30.33% |
0.7% |
|
2014 |
-7.18% |
0% |
|
2013 |
6.41% |
1.52% |
From this, it can be seen that one cannot exclude strong gold performance when the current CPI is very low. Some investors might be discouraged from buying bullion in low consumer price growth periods, but empirical observation shows that this is not a foregone conclusion that can be relied upon.
Conclusions
From simple observation, one can draw three important conclusions that can be used in timing gold bullion and coin purchase and sales:
- A low CPI environment does not ensure that gold prices will underperform. Gold has made some significant gains during periods of very low consumer price increases.
- Gold can have some significant annual gains during periods of above-target CPI, but is susceptible to sharp declines near the end of periods of high CPI.
- As can be seen by only general correlations, current CPI is not a reliable predictor of the gold price performance.
So, what can be learned from this analysis? One should exercise caution in purchasing gold after several periods of above-target CPI, as we have previously seen gold’s susceptibility to sell-offs near the end of a period of high consumer price increases. This also teaches us to take some profit on bullion positions during periods of high inflation. That’s because the market has historically allowed sellers to buy their bullion back at a lower price as CPI moves back below the Bank of England’s 2% target.
One should not shun bullion during periods of low CPI either, as all periods of low consumer price growth during this analysis were positive for gold relative to sterling. The findings of this analysis, however, could be specific to the time periods under scrutiny, with other exogenous factors possibly skewing results.
Past market performance is no guarantee of extrapolation, and therefore investors should conduct their own due diligence prior to buying or selling positions in gold bullion based on this research.


