

Matteo Colombo
(This article was co-produced with Hoya Capital Real Estate)
Introduction
This “serious” look at historical patterns that point to a positive outcome for US stocks in 2023 was inspired by Seeking Alpha having a contest for its Contributors to predict where the S&P 500 Index (SP500) will close at on 12/31/2023. That contest requires good, fundamental analysis, which this article isn’t nor my area of expertise. So good luck to my fellow writers. Let’s see what history “tells us” for 2023.
Presidential cycle
2023 is the 3rd year of President Biden’s first term; the year with the best market returns of the four-year term of a president.
sharesmagazine.co.uk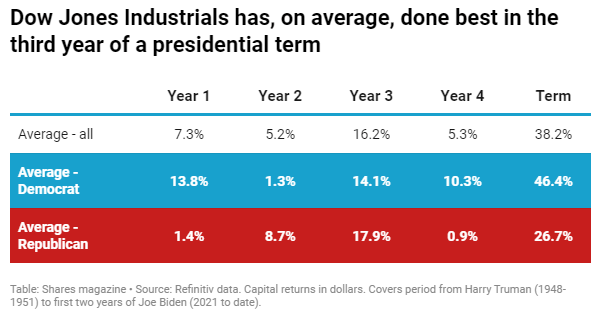
Since 1948, the 3rd year of the term has provided the best results for either party in office. In fact, only 2015 was even a down year during this time for 3rd years. Using S&P data back to 1928, in the third year the S&P 500 has been up 81.8% of the time, versus 68% of the time overall.
Unlike some indicators, there is some logic behind this one, such as the mid-term elections have past and in the next year there is an election. Having a strong economy bodes well for the administration’s party. Yardeni Research has a paper on the presidential cycle theory.
My thoughts: Of all the indicators, I give more credence to this one for the reason outline in the linked research report. The caveat for 2023 is what the FOMC does, especially if more than expected, and what the US House does in terms of investigating Hunter Biden, the FBI, and other “liberal” targets.
Unified or split government control
This table summarizes times when one party did not control all three parts.
hartfordfunds.com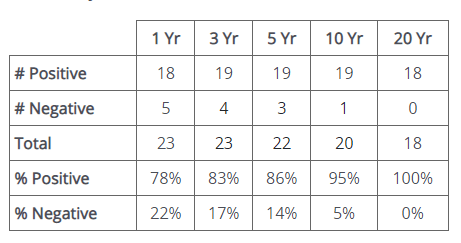
One-year results show about a 10% improvement over what overall results have been. When only looking at years when Congress was split, which has happened six times since 1947, the average gain was 14.7%, but up markets only occurred 66.6%; or about as expected.
To really put this in prospective, it needs to be compared to years when there was a unified government; the next table shows that.
hartfordfunds.com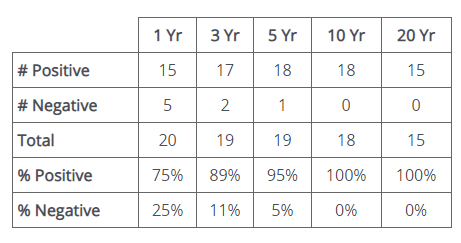
In terms of up or down markets, the non-unified government that starts in 2023, from a historical prospective, looks like a non-event.
My thoughts: I could not find data where the White House and Senate is one party and the House is the other. Another missing nuance is how close was the divide in each camber of Congress. With each controlling party having slim margins in Congress, passing anything major/controversial will be harder. That should and has proven a positive to the markets in the past.
Good years follow bad years
I recently heard this, probably from an optimist, so I checked it out. This data is S&P 500 Index data back to 1929.
macrotrends.net; compiled by Author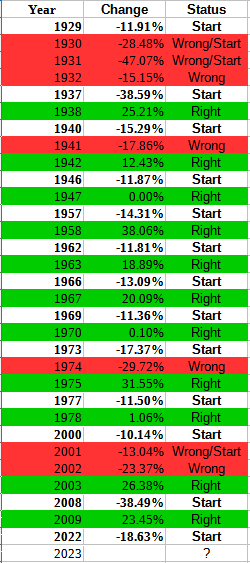
The theory is any year where the Index was down 10%, the next year would not see a decline. There are 16 such starting years; 2022 would be the 17th. With 11 correct predictions, that is 68.75%. Sounds like it works except for the fact the S&P 500 Index historically is not down 68.42% of the time. Also, twice when it was wrong, that bad prediction was followed by 1 or 2 years of more negative returns.
My thoughts: This indicator is based on calendar years; would it still work if done quarterly or monthly? It is a great example of the adage ” Correlation does not imply causation”. In reality, the results differ little from random market movements.
Rate cycle
With multiple rate hikes in 2022; plus predictions of more in the first half of 2023, that would mean next year would be under both parts of the cycle, increasing then decreasing rates. The next tables show how stocks have done under both.
institutionalinvestor.com Rate cycle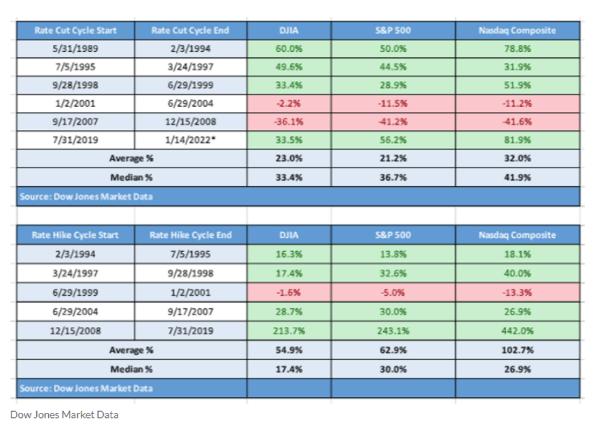
The article provides this explanation:
As a rule, the market cares for a couple of reasons. One is the potential slowdown of the U.S. economy and the other is the prospect of other investments like bonds becoming more attractive relative to stocks. The implications are that rates are going up to slow (not stop) the rate of economic growth. A strong economy can be very good for companies, but a tightening of monetary policy will put pressure on economic activity.
Source: institutionalinvestor.com
When you remove the post-GFC rally, the rate-hike average drops from 54% to 15%, or below what the average was when rates were being cut. I mention that so readers keep in mind what outlying data points can do to averages.
My thoughts: With the year most likely split between rising rates and stable rates, the falling rates data should be ignore as I haven’t seen any forecast that the FOMC will start cutting in 2023 (or 2024 for that matter). If you ignore the post-GFC, the 75% up markets is only slightly better than average.
Portfolio strategy
So once you have come up with your own estimate for 2023 via fundamental or technical analysis, the question becomes how best to maximize your profit? For that, the answer would be investing using a 3X Bull or Bear ETF, such as these:
- Direxion Daily S&P 500 Bull 3x Shares ETF (SPXL)
- Direxion Daily S&P 500 Bear 3x Shares ETF (SPXS)
The Pros and Cons of both ETFs were recently covered by other Seeking Alpha Contributors. If you are wrong, watch out as the next chart shows.
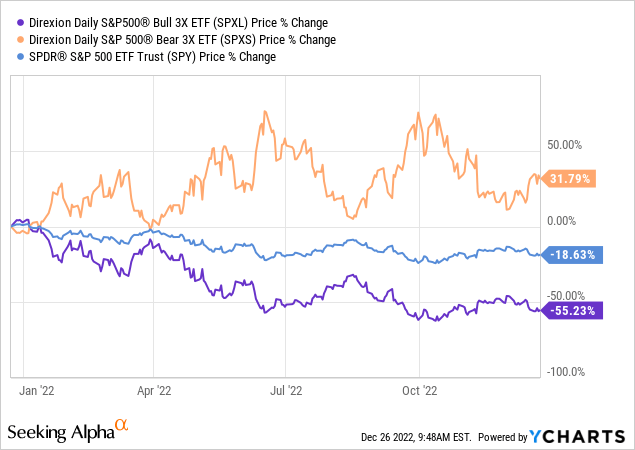
Leveraged ETFs such as SPXL and SPXS have some major shortcoming which make them poor long-term investments such as high fees, cost of futures, and the fact the X-factor applies to each time period of the ETF, mostly daily, causing value deterioration. Long-term investors seldom (if ever) earn the X-factor and this is plainly seen in the above chart. Two good resources risks these ETFs contain for investors are:
- Seeking Alpha article: Leveraged ETFs: What They Are & How They Work
- FINRA’s article: Lowdown on Leveraged and Inverse Exchange-Traded Products
With that caveat about using leveraged ETFs, the US stock market is up about 68% of the time based on calendar years. Based on that (and the “support” of all these positive “predictors”, here are two actionable strategies:
- Buy SPXL as the odds are in your favor, knowing your return most likely will be below 3X.
- Open a small position in SPXS as down-market insurance, maybe waiting on the next inflation report or FOMC meeting.
Final thoughts
I cannot tell readers what one “popular” indicator says as it hasn’t predicted yet: the winner of the Super Bowl indicator, which states the following:
The Super Bowl Indicator is a nonscientific barometer of the stock market. The idea behind the indicator is that a Super Bowl win for an NFL American Football Conference team predicts a stock market decline (a bear market) in the next year. On the other hand, a win for a team from the National Football Conference foretells a rise in the market or a bull run in the upcoming year. Leonard Koppett, a sportswriter for The New York Times, first introduced the Super Bowl Indicator in 1978. Up until that point, the Super Bowl Indicator had never been wrong.
Source: investopedia.com
There is a twist (and question). Because they were originally NFL teams, Cleveland, Pittsburgh, and Baltimore count as NFC teams. That said, do the Baltimore Ravens still count as NFC or AFC since the Colts were there when the indicator was “developed”, or should it now be Indianapolis?
The indicator has been correct 40 out of 55 times, as measured by the S&P 500 Index. This is a success rate of 73%. Of course, 2022 wasn’t one of those years as the Los Angeles Rams won the last Super Bowl. Also, by including the original NFL teams, it allowed Pittsburgh’s pre-indicator development victories to be on the right side of the indicator! And finally, since the game is played after the year started, results should reflect results only from the post-game time period: I have never seen what that means to its success rate.
The Skirt length theory is one I haven’t heard recently nor know its accuracy with the increase in women wearing pants, but here it is.
According to the skirt length theory, when skirts get shorter, it’s time to buy; when they get longer, the market’s hitting a peak. The idea here is that short skirts indicate fun times – and perhaps better economic conditions – while long, conservative skirts suggest a need to move toward practicality.
Finally there is the one reviewed by Seeking Alpha’s team: What Is The January Effect? While the article focuses on investing that month, other interpretations says:” How January goes, so goes the whole year.”. That along causes delay in starting and measuring the actual effect.
Betting against Up markets is a losing strategy. How cautious you want to be depends on many personal factors like: age, net worth, other income sources, and other financial obligations, now or in the future. My circumstances allow me to invest conservatively, thus no 3X ETFs in my portfolio.
S&P 500 Index Predictions
To read what other Seeking Alpha contributors think will happen in 2023 to that Index, with mostly a fundamental analysis focus, visit SP500 analysis. Read those for their insight, enjoy mine with your favorite beverage: cheers!
")

")


