

William_Potter
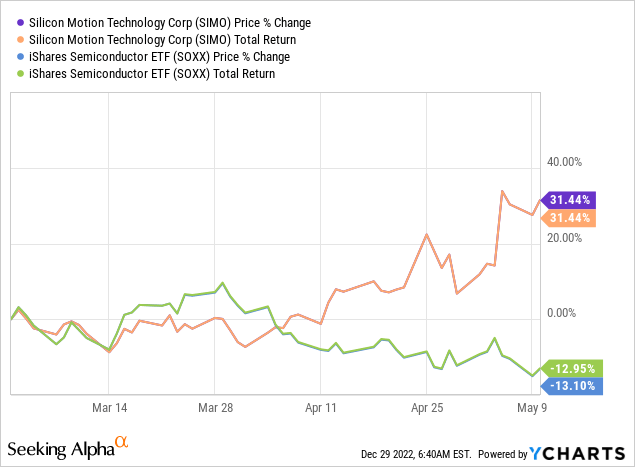
Silicon Motion Technology Corporation (NASDAQ:SIMO) is being acquired by MaxLinear, Inc. (MXL) for $93.45 per share and 0.388 shares of Max Linear. The latter trades at $32.67, so that means another $12.67 per share. That adds up to $106.12. The merger was first announced on May 5, 2022. Zooming in on a price chart around the announcement date, I guess rumors had been circulating ahead of the May 5 announcement. The jump on the day was relatively modest. I think the unaffected share price was likely around ~$70, with the caveat that semiconductor shares tend to be highly volatile. Silicon Motion is no exception to that general rule.
Where it gets interesting is that SIMO currently trades at $62.93 per share. This leaves an outstanding 68.63% upside to the takeout price.
The next earnings release should be around the end of January. Seeking Alpha data says the 23rd of January. I’d expect other earnings dates to be around the end of April, the end of July, and the end of October.
Forward implied annualized volatility (based on options data) is high 40’s for January and February, while increasing to the low 60s for March and June expirations.
30-day realized volatility over the past 3 years is generally in the 20-50 range, with peaks around the Covid selloff and the runup with the merger announcement coming up.
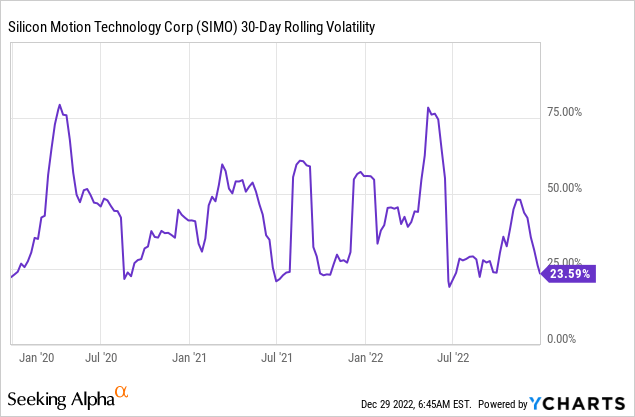
The volatility profile (isn’t yet) extremely different from its historical profile, although the forward implied is peculiar IMHO. My takeaway is that the option market implies the deal to be called off between February and March. Not coincidentally, the first outside date (from the merger agreement) is for February 6, 2023. However, there are extensions possible to May 5, 2023 and August 7, 2023.
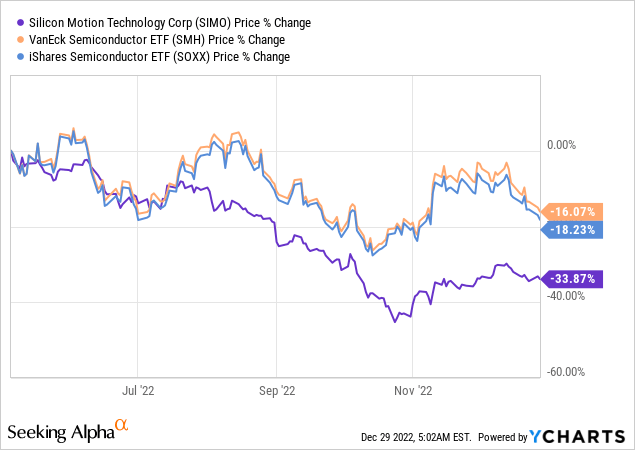
The performance year-to-date happens to be exactly in line with the major semiconductor averages like the iShares Semi ETF (SOXX) and the VanECK Semi ETF (SMH):
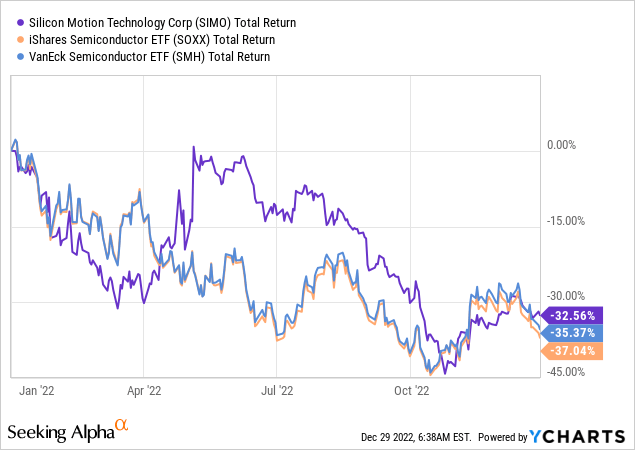
However, SIMO first fell much harder and then performed much better ahead of its deal. After the deal was signed, it did really poorly:
Even though only a tiny portion of the deal price would be paid in MXL stock.
It looks like the market believed in the deal at first and is now slowly starting to realize it is likely not to go through.
It is hard to say for sure, but I can understand the argument the break has been priced in. There are some counterarguments to that line of reasoning, though.
It has been my experience that SAMR (Chinese regulator) very rarely blocks deals, but it prevents some high-profile deals from closing. Often, spreads on mergers involving Chinese regulatory reviews are very wide. However, Gibson Dunn reckons of 700 reviewed transactions in 2021, China blocked only one. Having said that, I got burned by being long NXP Semiconductors (NXPI) when they were being acquired by Qualcomm (QCOM).
SIMO has been thrown out of the simplified review process (where most deals get quick approval) and is now stuck in the “normal” review process. If nothing else, this tends to be a drawn-out process. The companies have guided to the review process taking until the 2nd or 3rd quarter of 2023, or potentially even longer. My bet is on the even longer.
The U.S. has lately taken a tough stance on Chinese companies acquiring tech and specifically semiconductor companies. It is not unfathomable the Chinese regulator will be more inclined to stifle deals in the future (especially in the semi/tech industry).
This is another option chain where I suspect it could be interesting to do something with the options that are outstanding. This isn’t a very liquid opportunity – this isn’t Tesla Inc. (TSLA) – which is why I’m only sharing it here for now.
I pulled up the companies’ share price developments Seeking Alpha lists as peers since the merger announcement:
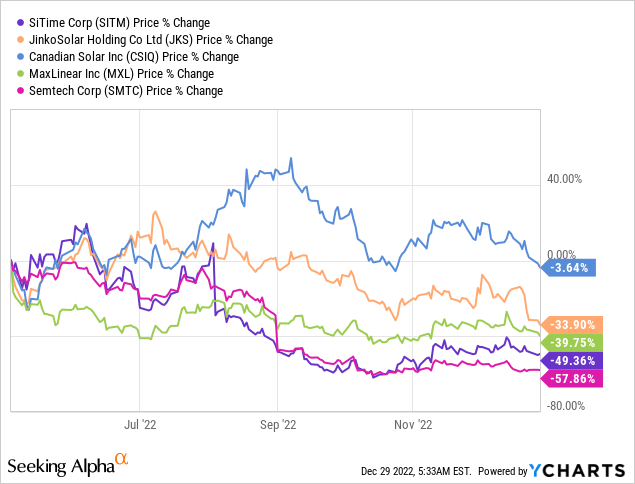
These got slammed pretty hard. I also pulled up the price developments of companies that Seeking Alpha views as related companies. That means people who are interested in SIMO are often also interested (read: have in their portfolio) in the companies below:
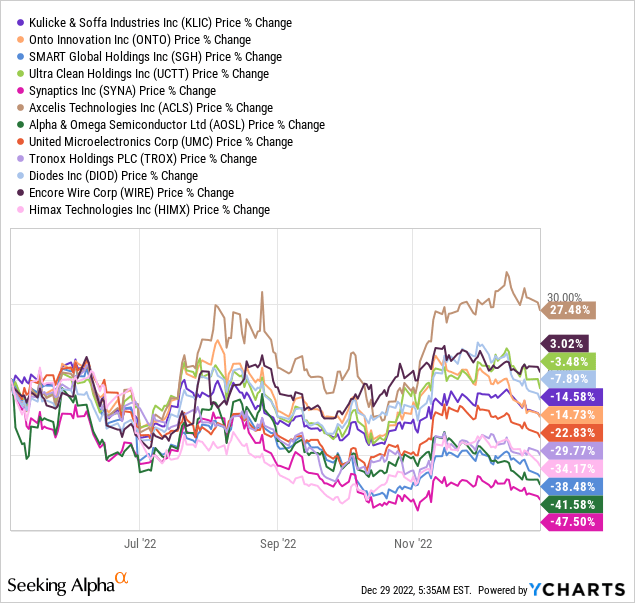
In general, these got slammed hard as well. This indicates this being a small cap semi, it could have done worse even. If it traded entirely freely, that’s a possibility.
At the same time, the fact that the related companies got slammed so hard can also mean this subset of investors may have engaged in some forced or semi-forced selling. Sometimes you sell because you think something has reached fair value, but other times, you sell for portfolio or risk management reasons, or you’re forced because of margin calls. This supports the price undershooting below a price that’s reasonable, given the fundamentals and odds of the merger going through.
Fundamentals
I need to shout out to Andrew Walker of Yet Another Value Podcast and Mordechai Yavneh, founder, and PM at Focus Capital, who discussed this idea. I’ve included the full video below because Yavneh seems to have a grasp of industry fundamentals. I don’t, and I can’t do the fundamentals the justice they deserve in this article alone. Andrew is very knowledgeable about a range of businesses and business models, works very hard to uncover value, and I highly recommend subbing to his podcast and/or substack.
I may not have looked into SIMO as soon as I did if not for their discussion. I have been burned with China-related semi-M&A enough lately.
Aside from Yavneh’s view, I also like to take note of analyst estimates. Consensus estimates are for $7.10 in earnings. Admittedly, the spread is wide between the low of $5.27 and the high of $12.01.
consensus EPS estimates SIMO (Seeking Alpha)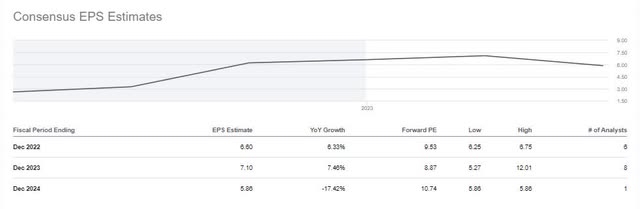
EPS are generally being revised downwards lately:
consensus EPS revisions (Seeking Alpha)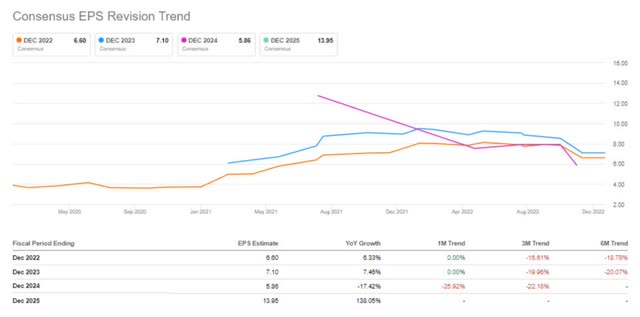
I pulled up a table with valuation data from Seeking Alpha. The first table shows the Seeking Alpha peer group. I think they’re not great comps in this case, but here it is. I’ve emphasized forward P/E and forward EV/EBITDA data. SIMO appears to be valued on the lower end of the range.
Valuation
|
SIMO |
SITM |
JKS |
CSIQ |
MXL |
SMTC |
|
|---|---|---|---|---|---|---|
| P/E Non-GAAP (FY1) |
9.53 |
27.25 |
10.55 |
11.50 |
7.66 |
9.83 |
| P/E Non-GAAP (FY2) |
8.87 |
53.35 |
6.10 |
7.15 |
8.24 |
12.44 |
| P/E Non-GAAP (FY3) |
10.74 |
36.97 |
5.20 |
6.15 |
7.50 |
9.54 |
| P/E Non-GAAP ((TTM)) |
8.95 |
22.41 |
15.36 |
11.76 |
8.03 |
9.07 |
| P/E GAAP ((FWD)) |
11.01 |
93.50 |
41.62 |
11.31 |
19.56 |
13.92 |
| P/E GAAP ((TTM)) |
10.20 |
49.22 |
83.69 |
10.80 |
21.21 |
11.91 |
| PEG Non-GAAP ((FWD)) |
0.48 |
– |
– |
0.30 |
0.24 |
0.70 |
| PEG GAAP ((TTM)) |
0.19 |
0.29 |
NM |
0.08 |
NM |
0.28 |
| Price/Sales ((TTM)) |
2.10 |
6.80 |
0.20 |
0.27 |
2.33 |
2.25 |
| EV/Sales ((FWD)) |
1.98 |
5.42 |
0.85 |
0.51 |
2.27 |
2.16 |
| EV/Sales ((TTM)) |
1.95 |
5.13 |
0.97 |
0.54 |
2.36 |
2.05 |
| EV/EBITDA ((FWD)) |
7.07 |
19.04 |
22.94 |
7.30 |
5.98 |
6.92 |
| EV/EBITDA ((TTM)) |
7.10 |
34.95 |
26.02 |
5.70 |
10.24 |
7.78 |
| Price to Book ((TTM)) |
3.00 |
3.00 |
0.91 |
1.06 |
4.12 |
2.21 |
| Price/Cash Flow ((TTM)) |
21.99 |
34.97 |
29.34 |
NM |
7.57 |
8.90 |
Investors that are interested in SIMO also like to look at the following companies:
| Ticker | Company Name | Market Cap | PE Ratio |
Price / Book |
EV / EBITDA. Vol |
|---|---|---|---|---|---|
|
SIMO |
Silicon Motion Technology Corporation |
2.17B |
10.20 |
3.00 |
7.10 |
|
KLIC |
Kulicke and Soffa Industries, Inc. |
2.47B |
6.11 |
2.07 |
3.54 |
|
ONTO |
Onto Innovation Inc. |
3.27B |
16.14 |
2.08 |
9.27 |
|
MXL |
MaxLinear, Inc. |
2.54B |
21.21 |
4.12 |
10.24 |
|
SGH |
SMART Global Holdings, Inc. |
723.40M |
12.04 |
1.92 |
4.72 |
|
UCTT |
Ultra Clean Holdings, Inc. |
1.46B |
25.28 |
1.70 |
5.40 |
|
SYNA |
Synaptics Incorporated |
3.59B |
13.00 |
2.72 |
6.46 |
|
ACLS |
Axcelis Technologies, Inc. |
2.54B |
16.12 |
4.14 |
10.81 |
|
AOSL |
Alpha and Omega Semiconductor Limited |
762.49M |
1.75 |
0.86 |
3.91 |
|
UMC |
United Microelectronics Corporation |
16.54B |
6.33 |
1.67 |
2.86 |
|
TROX |
Tronox Holdings plc |
2.04B |
3.53 |
0.90 |
4.98 |
|
DIOD |
Diodes Incorporated |
3.37B |
11.20 |
2.41 |
6.46 |
|
WIRE |
Encore Wire Corporation |
2.53B |
3.90 |
1.50 |
2.11 |
|
HIMX |
Himax Technologies, Inc. |
1.09B |
3.24 |
1.29 |
3.02 |
|
ARCB |
ArcBest Corporation |
1.69B |
5.49 |
1.50 |
3.19 |
Given the above data, I would think the company could still sell off, if the merger were to break.
Finally, I also looked into Morningstar data for funds that are buying SIMO shares:
|
Name |
% TotalShares Held |
% TotalAssets |
Change Amount |
Date |
|---|---|---|---|---|
| The Merger Fund A | 2.75 | 1.42 |
222,075 |
Sep 30, 2022 |
| Arbitrage R | 0.72 | 1.21 |
153,765 |
Aug 31, 2022 |
| GMO Implementation | 0.55 | 0.35 |
129,797 |
Aug 31, 2022 |
| Loomis Sayles Small Cap Growth CIT D | 0.31 | 1.06 |
75,472 |
Mar 31, 2022 |
| USAA Science & Technology | 0.13 | 0.29 |
42,251 |
Sep 30, 2022 |
| Virtus Westchester Event-Driven Fd I | 0.24 | 1.70 |
22,938 |
Sep 30, 2022 |
| Dunham Monthly Distribution A | 0.49 | 3.96 |
16,200 |
Oct 31, 2022 |
| JNL Multi-Manager Alternative A | 0.13 | 0.25 |
11,199 |
Sep 30, 2022 |
| Water Island Event-Driven Fund I | 0.05 | 1.19 |
11,131 |
Aug 31, 2022 |
| RS Science And Technology Composite | 0.03 | 0.41 |
10,930 |
Sep 30, 2022 |
| Victory RS Science and Technology A | 0.03 | 0.41 |
10,930 |
Sep 30, 2022 |
| C&P Funds QuantiX | 0.11 | 0.91 |
9,800 |
Nov 30, 2022 |
| Vector Navigator C1 Acc | 0.08 | 0.92 |
6,647 |
Nov 30, 2022 |
| PIMCO RAE Emerging Markets | 0.04 | 0.06 |
6,030 |
Mar 31, 2022 |
| HJIM Emerging Markets Large Cap | 0.02 | 1.97 |
5,000 |
Jul 31, 2022 |
| Franklin K2 Alt Strats I(acc)USD | 0.01 | 0.02 |
4,697 |
Nov 30, 2022 |
| CS ((LUX)) Multi-Advisor Eq Alpha FB USD | 0.08 | 1.73 |
4,564 |
Jun 30, 2022 |
| LoCorr Dynamic Equity I | 0.03 | 1.67 |
4,475 |
Sep 30, 2022 |
| USAA Emerging Markets | 0.21 | 0.81 |
4,106 |
Sep 30, 2022 |
| Franklin K2 Alternative Strategies R6 | 0.01 | 0.02 |
3,835 |
This looks like a lot of merger arb and relative value funds.
And the largest holders of SIMO shares:
|
Name |
% TotalShares Held |
Date |
|---|---|---|
| Goldman Sachs Group Inc | 4.23 | Sep 30, 2022 |
| Millennium Management LLC | 3.29 | Sep 30, 2022 |
| Westchester Capital Management LLC | 3.25 | Sep 30, 2022 |
| Sand Grove Capital Management LLP | 3.03 | Sep 30, 2022 |
| Bank of America Corp | 2.96 | Sep 30, 2022 |
| Mangrove Partners | 2.24 | Sep 30, 2022 |
| Grantham, Mayo, Van Otterloo & Co., LLC | 2.17 | Sep 30, 2022 |
| Adage Capital Partners Gp LLC | 2.11 | Sep 30, 2022 |
| State Street Corporation | 1.94 | Sep 30, 2022 |
| Antara Capital LP | 1.68 | Sep 30, 2022 |
| Systematic Financial Management LP | 1.55 | Sep 30, 2022 |
| Melqart Asset Management ((UK)) Ltd. | 1.42 | Sep 30, 2022 |
| Cardinal Capital Management Llc | 1.38 | Sep 30, 2022 |
| Cnh Partners, LLC | 1.33 | Sep 30, 2022 |
| Baillie Gifford & Co Limited. | 1.32 | Sep 30, 2022 |
| Morgan Stanley – Brokerage Accounts | 1.25 | Sep 30, 2022 |
| Acadian Asset Management LLC | 1.23 | Sep 30, 2022 |
| Herald Investment Management Limited | 1.16 | Sep 30, 2022 |
| Marshall Wace Asset Management Ltd | 1.16 | Sep 30, 2022 |
| Lazard Asset Management LLC | 1.07 | Sep 30, 2022 |
Conclusion
Notwithstanding the enormous upside potential, I don’t like this Silicon Motion Technology Corporation merger enough yet. The normal Chinese review process could be very lengthy. I do like the options angle, which I’ve only shared on The Special Situations Report for now. I’m not looking for regular semiconductor exposure (and to regard the M&A process as a free option). I do think this is an exciting idea (as explained on Yet Another Value Podcast) for people who are comfortable with that risk profile.
I’m also generally quite bearish on tech for 2023 (admittedly, I’m too often bearish and too often wrong for my liking as well). I’m already stuck in a merger arb turned bag-holder situation with Magnachip Semiconductor (MX). Magnachip may not have the upside potential of SIMO, but it looks like a much safer situation within the semi-space.


")


