Get ready for charts, images, and tables because they are better than words. The ratings and outlooks we highlight here come after Scott Kennedy’s weekly updates in the REIT Forum. Your continued feedback is greatly appreciated, so please leave a comment with suggestions.
Time for a little light reading with a side of math. If you hated math, you probably wouldn’t read my articles.
I’m going to share part of the big preferred share update I posted for members of The REIT Forum.
The first update covers preferred shares from Annaly Capital Management (NLY).
We’ve written about the mispricing in shares quite a few times. For instance, on November 3rd, 2022, we wrote about a stock with 40% upside and a 12% dividend yield.
However, we included commentary on far more than one stock.
We started out by discussing the dramatic difference in performance between the various preferred shares for AGNC Investment Corp. (AGNC) and NLY.
We wrote:
The difference in performance is absurd. Investors in AGNCN and NLY-F are roughly even year-to-date (including dividends). Maybe down as much as 2%. That’s amazing given the 20% drop on other shares. How much would you pay to have shares float two years earlier? 20%? That would be a really dumb idea. Who pays 20% so they can get two years of collecting about 11% rather than collecting about 8.3%? Is an extra 3% or so for two years’ worth 20%? No, because math still works. Paying 20% to get back somewhere around 6% is just an awful idea.
Paying more today than can hope to get back in the future is not investing. That’s literally the opposite of investing. Terrible. I’ve got over this extensively in prior articles. Will the market fail even harder? Maybe. As it stands, the long-term math is definitive. Eventually, we all know AGNCN and NLY-F will deliver weaker returns than the other preferred shares in the chart. Well, those of us who can do math know it. Regardless, this market failure has been going on for months and continued to get even worse.
On one share this isn’t material, but for investors swapping a few thousand shares, it’s an outstanding return.
Now, how do you think that played out?
I won’t keep you in suspense.
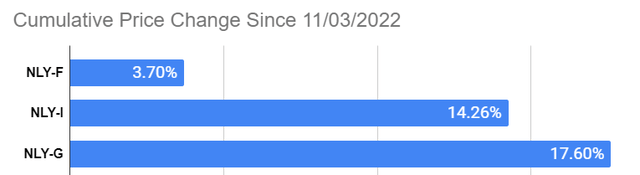
NLY-F (NLY.PF) underperformed NLY-I (NLY.PI) and NLY-G (NLY.PG):
The REIT Forum
Look at that; it turns out that analysis based on projected future cash flows is a great tool.
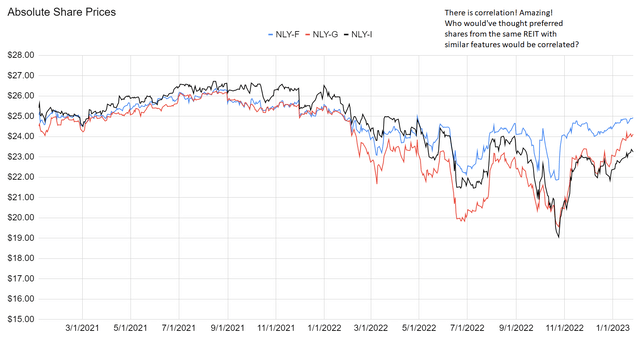
This analysis wasn’t hard. Seriously, it was absurdly easy. The shares trade in strong correlation with each other:
The REIT Forum
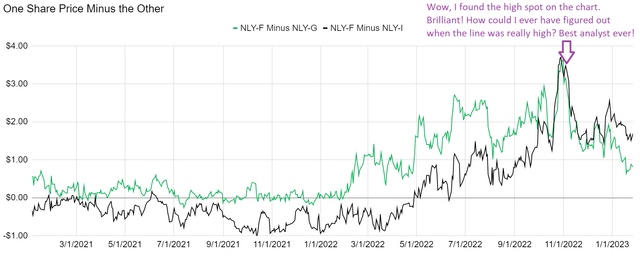
How could anyone ever figure out when shares of NLY-F were far too expensive relative to NLY-G and NLY-I? Are they just going to try to track the difference in the lines? No, of course not. You would convert it to another chart:
The REIT Forum
That was hard! Who could ever do such an insanely difficult job? Clearly, it is impossible to beat the market because the market prices are perfectly efficient. We got really lucky in figuring out which direction on the chart was up! Or maybe it was which side of the chart was right? Sometimes people get confused.
Since the call-out, the spread between the shares crashed hard.
For the investor with $50k invested, that idea was already worth more than $5k going to NLY-I. If the investor went to NLY-G, it was already worth almost $7k.
Well, that brings us to the next point.
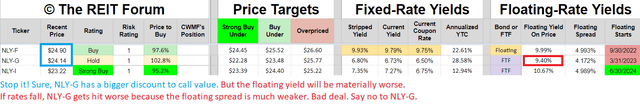
NLY-G rebounded too hard.
NLY-G still has more upside to call value than NLY-F, but NLY-F offers a materially bigger floating yield. Unless you really expect NLY-G to be called (which is unlikely), the yield on NLY-F wins. NLY-I is still a little bit better than NLY-F, but NLY-F has the edge on more price stability if fear in the market roars up again. You can pick NLY-F or NLY-I and be an intelligent investor. They aren’t the best deals in the sector by any means, but they still offer a reasonable return.
Picking NLY-G today is simply not a good idea.
Math A Child Can Follow
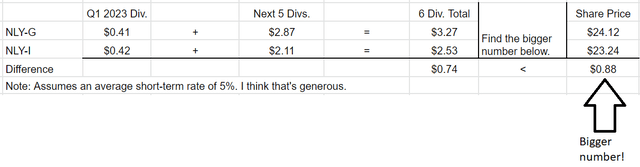
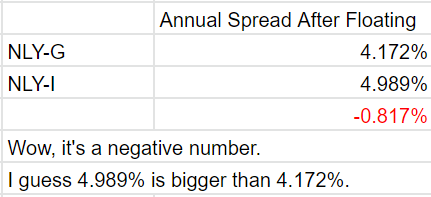
Let’s see if we can figure out if the difference in share prices is bigger than the difference in dividends from NLY-G floating before NLY-I:
The REIT Forum
That was super tough. What if NLY calls both shares? Well, the investor has a lower net price in NLY-I. I don’t think NLY-G will get called, but we’re doing the hypothetical for people who think shares always get called.
But which share will pay more after 6/30/2024 when both shares are floating? Here comes more math:
The REIT Forum
Well, it looks like NLY-I will have a bigger floating dividend than NLY-G. Therefore, the investor in NLY-I gets more money in each quarter that both shares are floating. More money is better than less money, so when both shares are floating you would clearly prefer to own NLY-I.
The difference of .817% is worth a little over $.20 per share per year. I prefer more money to less money.
What if you needed the income today? NLY-G has a bigger dividend! Sure, but you saved $.88 by purchasing NLY-I instead. You can withdraw part of that each quarter to cover the difference.
But what if you have the $.88 savings and you just spend it all buying useless crap in the first month? Learn how to not waste your money.
As we wrote for subscribers in our huge update:
NLY-G (NLY.PG) is a raw deal compared to the others. NLY-F (NLY.PF) is better and NLY-I (NLY.PI) is better than that for investors with a bit of patience.
The REIT Forum
Investors concerned about near-term downside may argue for a low risk rating and a high yield today. Fine. They can pick NLY-F. It’s not the best deal, but it’s only 15% off the 52-week low (a much lower rally than the sector average), plus it has a high yield today. That’s an okay combination today.
Yes, we bashed on NLY-F regularly for being too expensive relative to many other shares. I lost track of how many articles were spent pounding that point home.
As the market demonstrated thoroughly, we were precisely accurate in that call. NLY-F has dramatically underperformed. That’s the difference in performance we were predicting. Now that the other shares have already provided much larger capital gains, there’s no reason to continue bashing NLY-F.
Bashing NLY-G? Fair game.
Feel free to tell me I’m wrong, or go check the comments on the piece I linked and see how many people still believed NLY-F was the cat’s meow.
Stock Table
We will close out the rest of the article with the tables and charts we provide for readers to help them track the sector for both common shares and preferred shares.
We’re including a quick table for the common shares that will be shown in our tables:
Let the images begin!
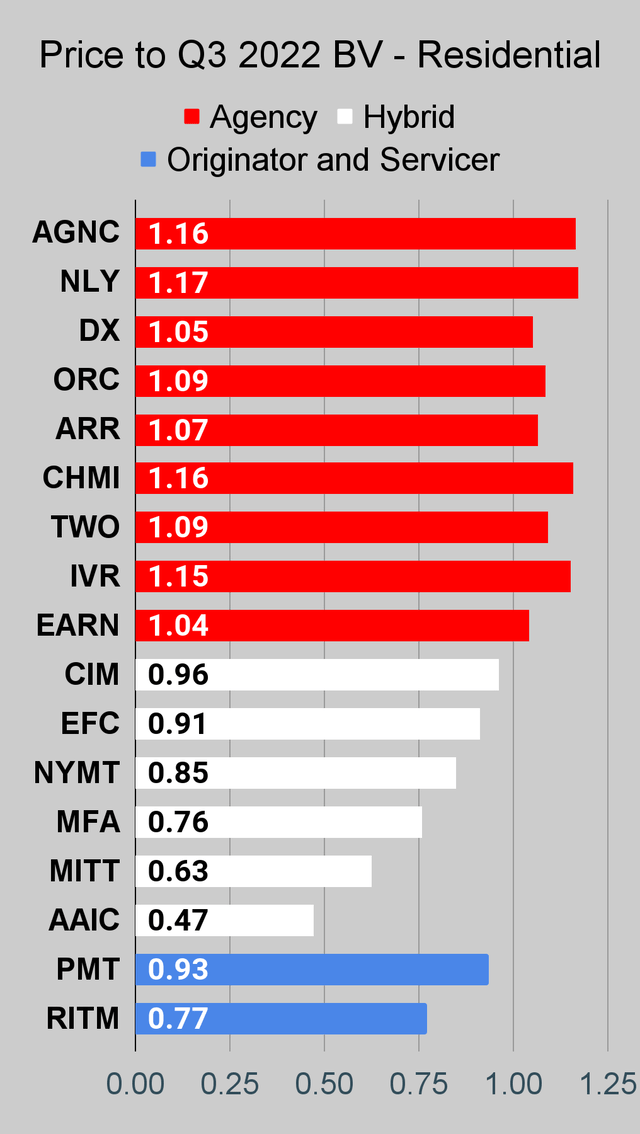
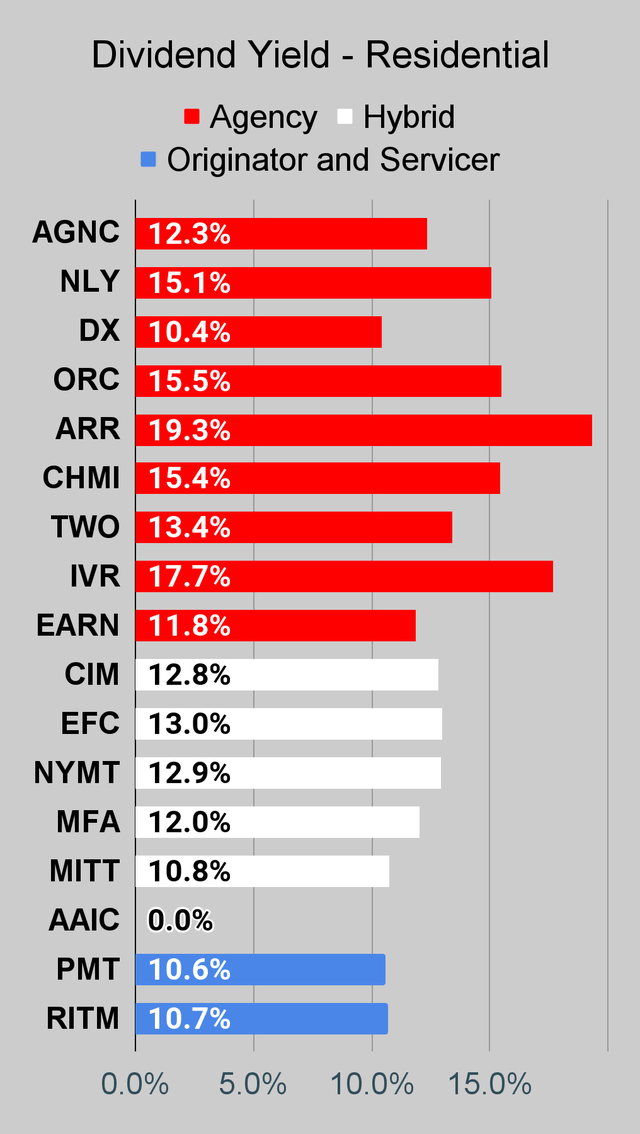
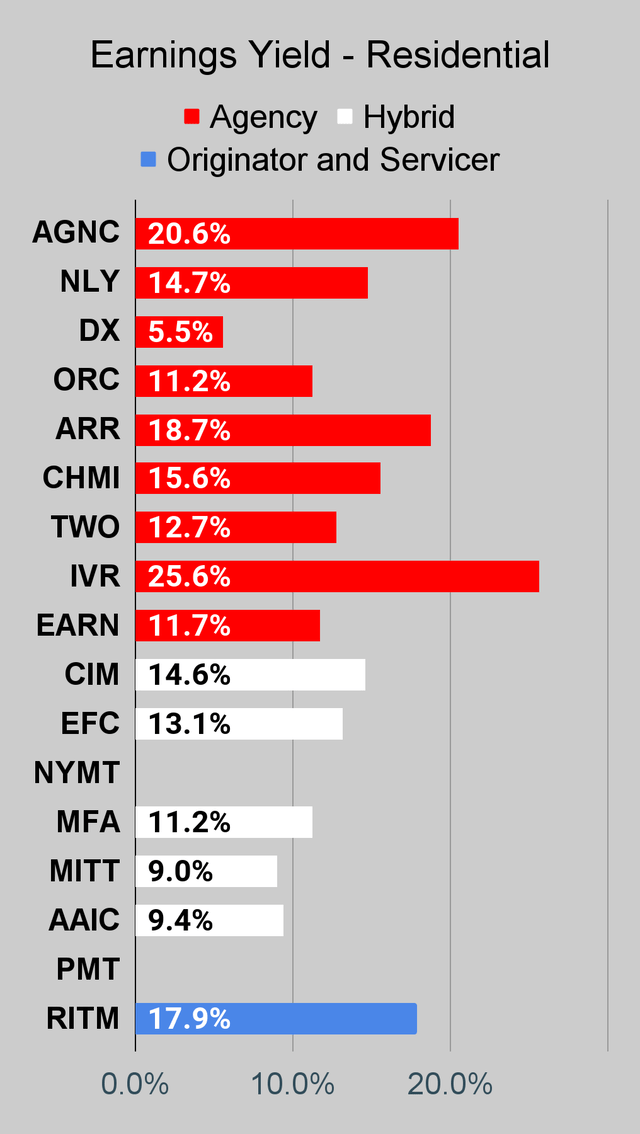
Residential Mortgage REIT Charts
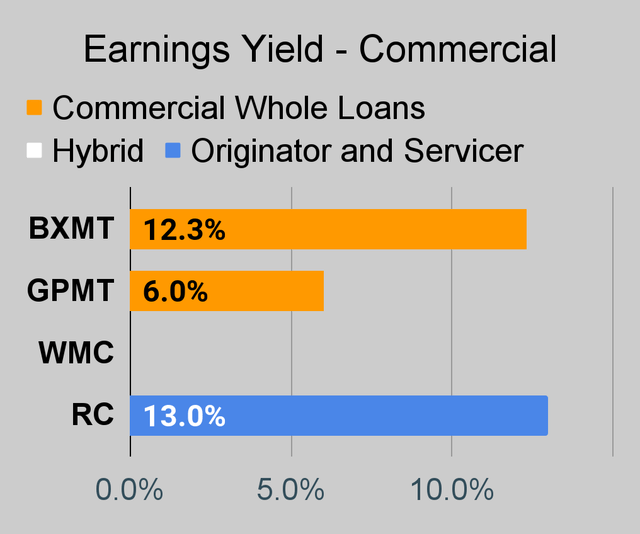
Note: The chart for our public articles uses the book value per share from the latest earnings release. Current estimated book value per share is used in reaching our targets and trading decisions. It is available in our service, but those estimates are not included in the charts below. PMT and NYMT are not showing an earnings yield metric as neither REIT provides a quarterly “Core EPS” metric.
Second Note: Due to the way historical amortized cost and hedging is factored into the earnings metrics, it is possible for two mortgage REITs with similar portfolios to post materially different metrics for earnings. I would be very cautious about putting much emphasis on the consensus analyst estimate (which is used to determine the earnings yield). In particular, throughout late 2022 the earnings metric became less comparable for many REITs.
The REIT Forum
The REIT Forum
The REIT Forum
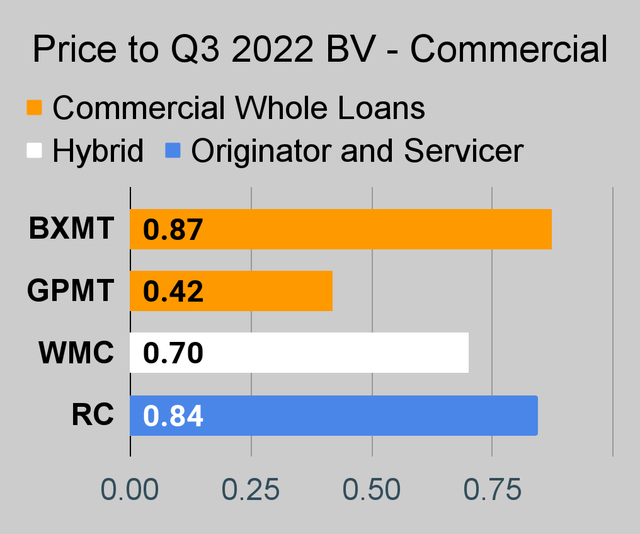
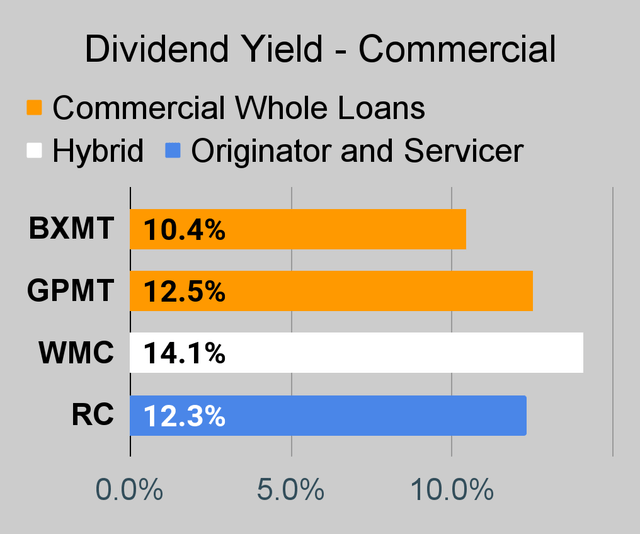
Commercial Mortgage REIT Charts
The REIT Forum
The REIT Forum
The REIT Forum
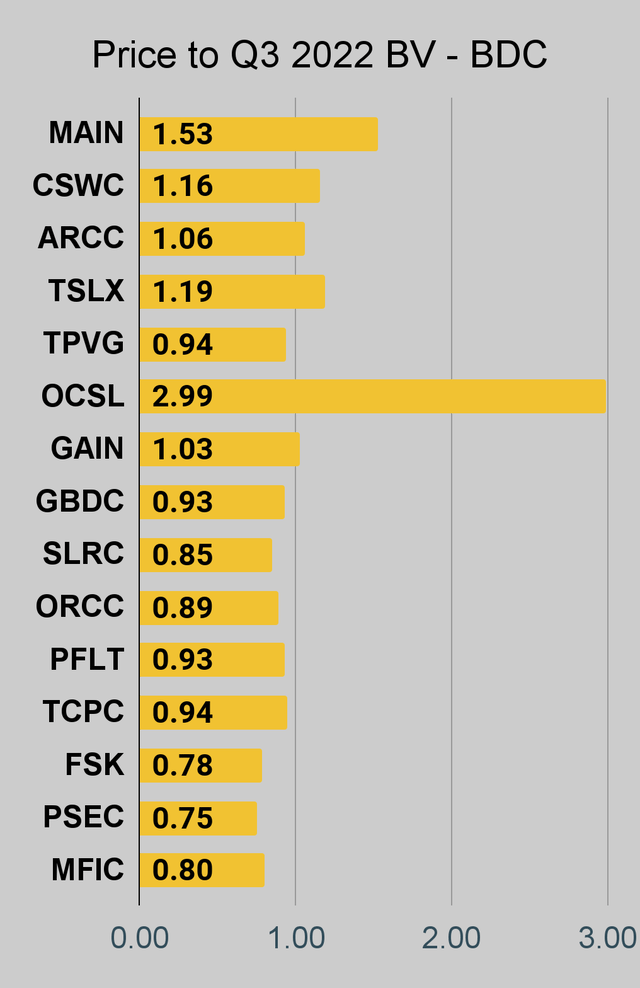
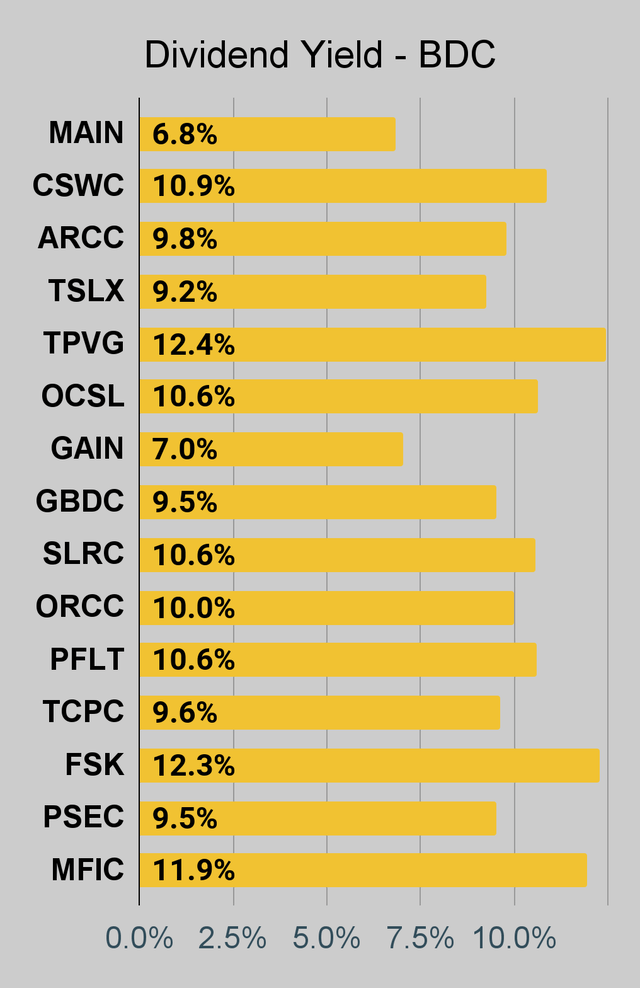
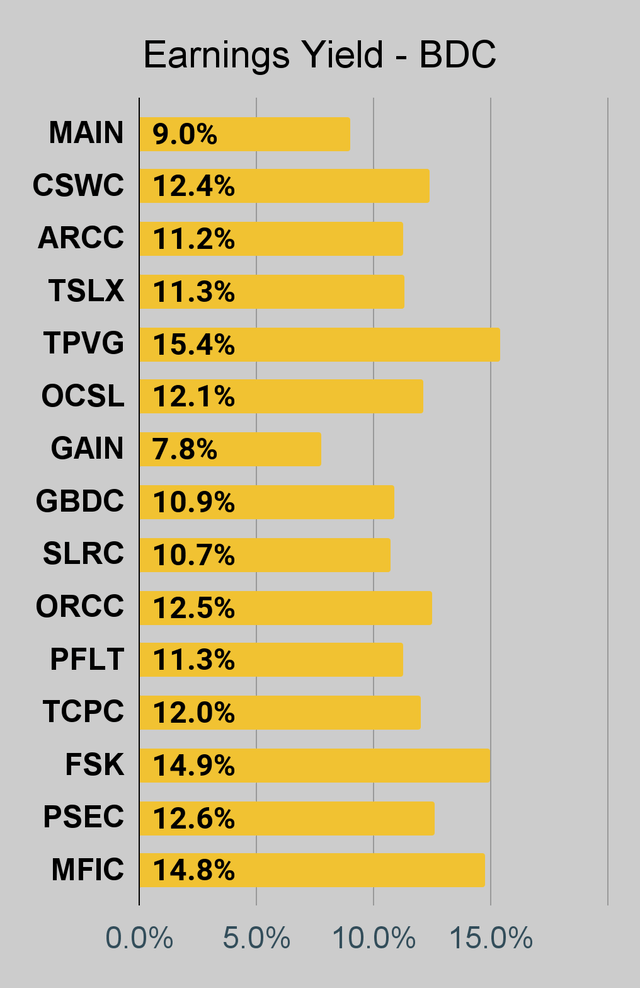
BDC Charts
The REIT Forum
The REIT Forum
The REIT Forum
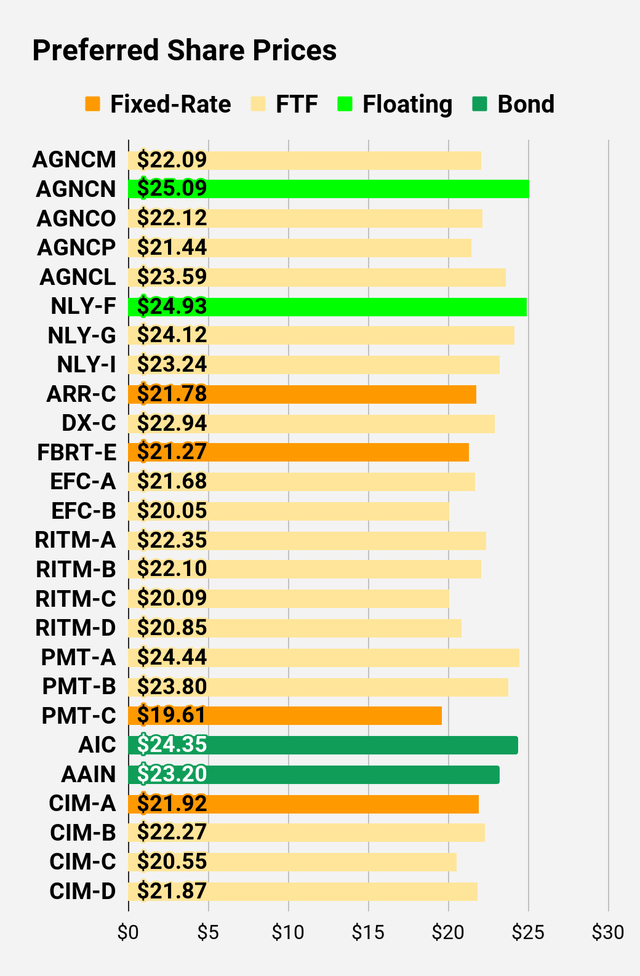
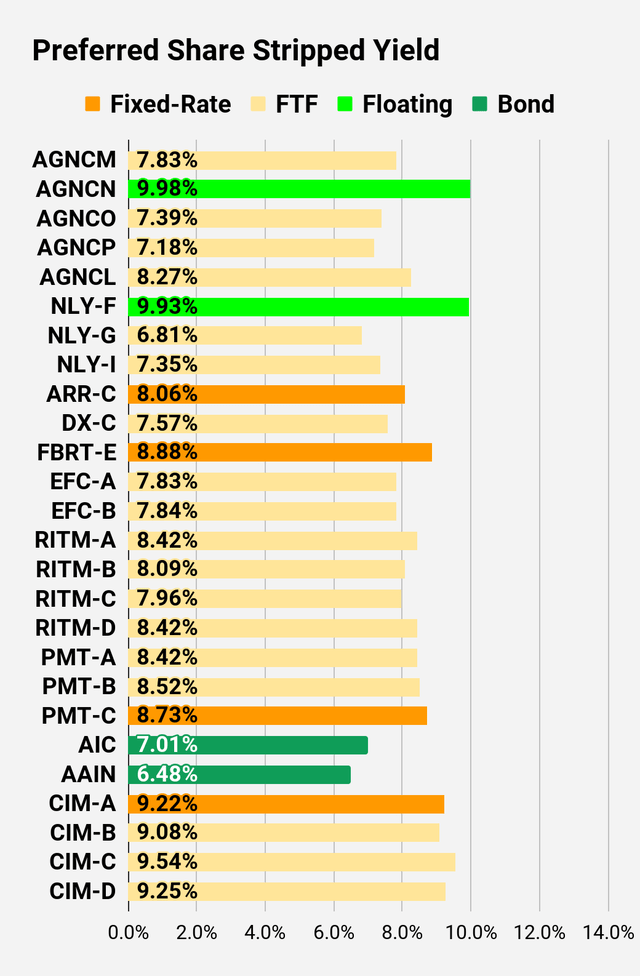
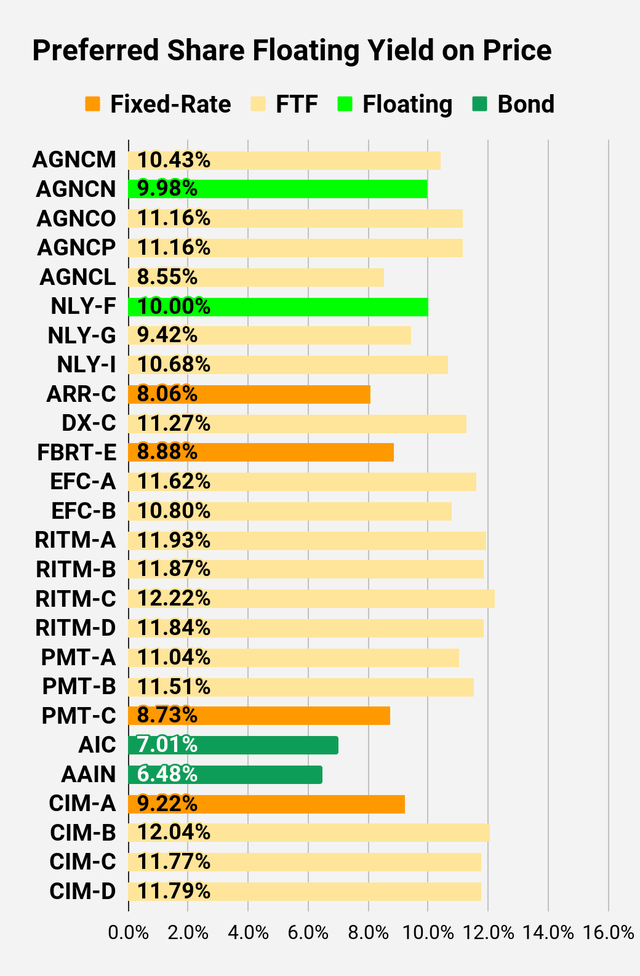
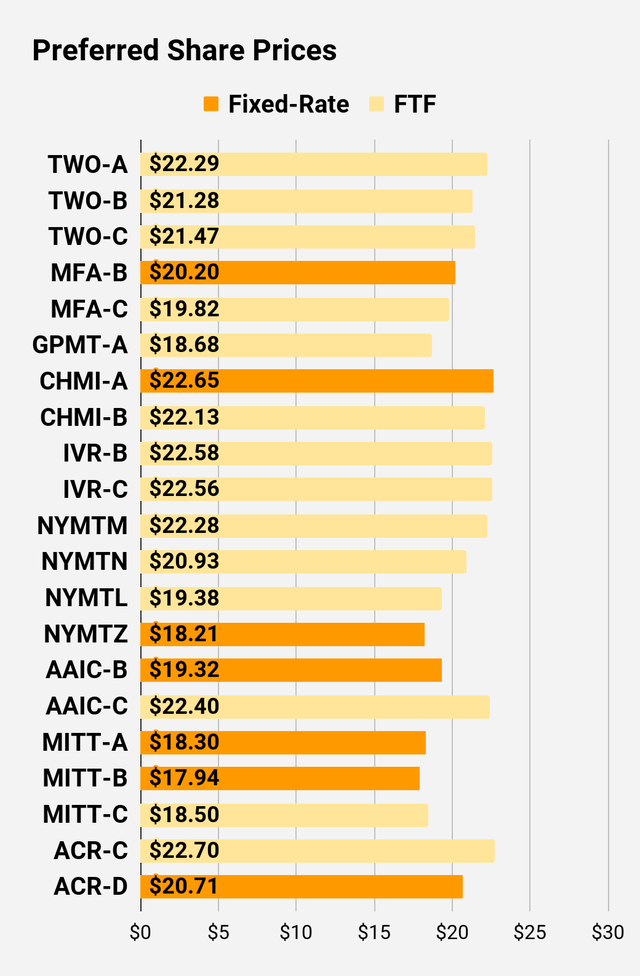
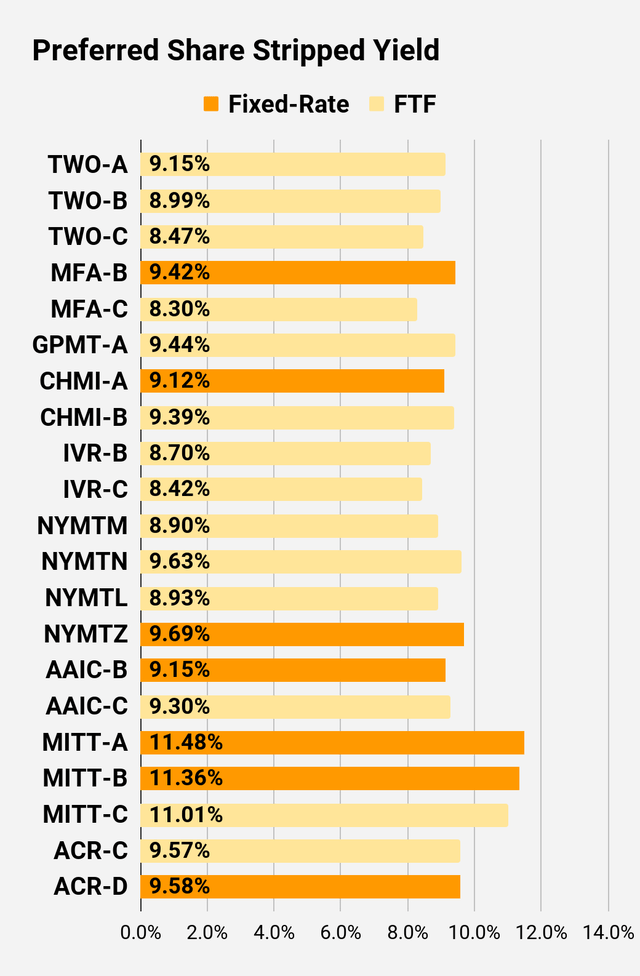
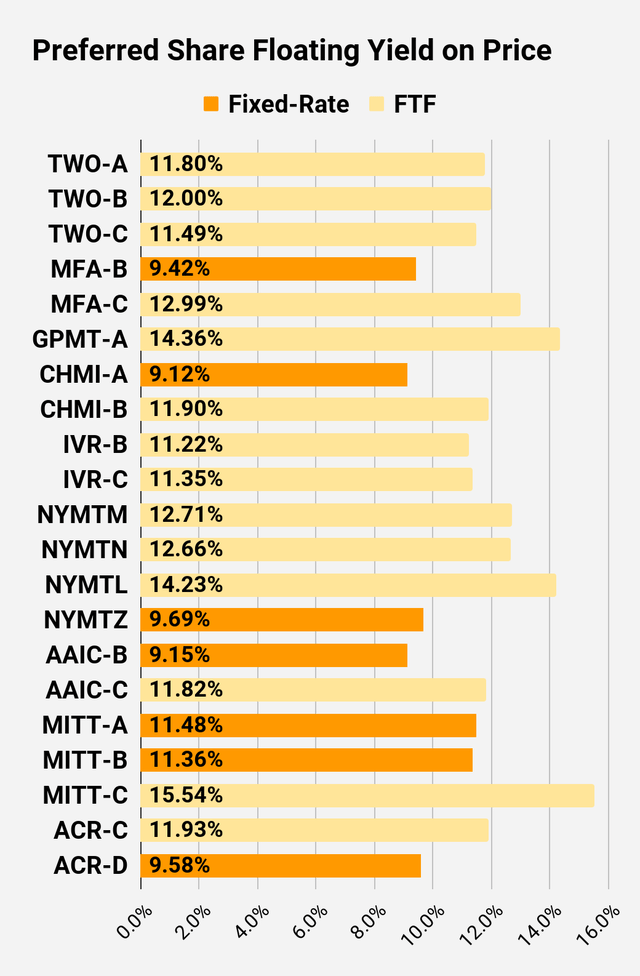
Preferred Share Charts
I changed the coloring a bit. We needed to adjust to include that the first fixed-to-floating shares have transitioned over to floating rates. When a share is already floating, the stripped yield may be different from the “Floating Yield on Price” due to changes in interest rates. For instance, NLY-F already has a floating rate. However, the rate is only reset once per 3 months. The stripped yield is calculated using the upcoming projected dividend payment and the “Floating Yield on Price” is based on where the dividend would be if the rate reset today. In my opinion, for these shares the “Floating Yield on Price” is clearly the more important metric.
The REIT Forum
The REIT Forum
The REIT Forum
The REIT Forum
The REIT Forum
The REIT Forum
Preferred Share Data
Beyond the charts, we’re also providing our readers with access to several other metrics for the preferred shares.
After testing out a series on preferred shares, we decided to try merging it into the series on common shares. After all, we are still talking about positions in mortgage REITs. We don’t have any desire to cover preferred shares without cumulative dividends, so any preferred shares you see in our column will have cumulative dividends. You can verify that by using Quantum Online. We’ve included the links in the table below.
To better organize the table, we needed to abbreviate column names as follows:
Price = Recent Share Price – Shown in Charts
BoF = Bond or FTF (Fixed-to-Floating)
S-Yield = Stripped Yield – Shown in Charts
Coupon = Initial Fixed-Rate Coupon
FYoP = Floating Yield on Price – Shown in Charts
NCD = Next Call Date (the soonest shares could be called)
Note: For all FTF issues, the floating rate would start on NCD.
WCC = Worst Cash to Call (lowest net cash return possible from a call)
QO Link = Link to Quantum Online Page
Second Batch:
Strategy
Our goal is to maximize total returns. We achieve those most effectively by including “trading” strategies. We regularly trade positions in the mortgage REIT common shares and BDCs because:
Prices are inefficient.
Long-term, share prices generally revolve around book value.
Short-term, price-to-book ratios can deviate materially.
Book value isn’t the only step in analysis, but it is the cornerstone.
We also allocate to preferred shares and equity REITs. We encourage buy-and-hold investors to consider using more preferred shares and equity REITs.
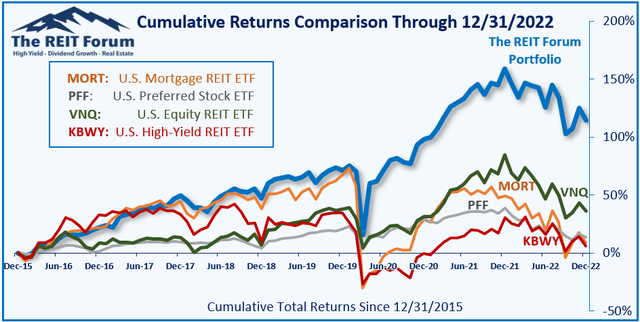
Performance
We compare our performance against 4 ETFs that investors might use for exposure to our sectors:
The REIT Forum
The 4 ETFs we use for comparison are:
Ticker
Exposure
MORT
One of the largest mortgage REIT ETFs
PFF
One of the largest preferred share ETFs
VNQ
Largest equity REIT ETF
KBWY
The high-yield equity REIT ETF. Yes, it has been dreadful.
When investors think it isn’t possible to earn solid returns in preferred shares or mortgage REITs, we politely disagree. The sector has plenty of opportunities, but investors still need to be wary of the risks. We can’t simply reach for yield and hope for the best. When it comes to common shares, we need to be even more vigilant to protect our principal by regularly watching prices and updating estimates for book value and price targets.
Ratings: No bear/bull rating. Predicting that NLY-I (at $23.24) and NLY-F (at $24.93) will outperform NLY-G (at $24.12).
Editor’s Note: This article covers one or more microcap stocks. Please be aware of the risks associated with these stocks.


")

")
")


")
 — RT World News")


