

[ad_1]
sasirin pamai/iStock via Getty Images
This article was co-produced by Williams Equity Research
Introduction
Business Development Companies (“BDCs”), like Real Estate Investment Trusts (“REITs”) and Master Limited Partnerships (“MLPs”), are tax-advantaged company structures created by legislation to solve certain problems.
In the case of REITs, it was to give the average investor access to diversified real estate at a reasonable cost and incentivize investment by eliminating taxation at the corporate level. MLPs increased the ability to raise money for infrastructure (usually but not exclusively energy assets) in a similar way.
There are trillions of dollars in these two hard asset sectors.
BDCs take a different approach. They are not in the business of owning hard assets. Instead, BDCs are required to invest at least 70% of their capital in the debt or equity of U.S. businesses. In practice, these are private companies that depend on BDCs for a significant portion of their lending needs.
While regular banks can and still do play a role, it often requires a BDC to help a company take on debt to buy out management, expand their operational footprint, or invest in a new business line. BDCs have other types of constraints as well, such as limits on leverage. That was increased by Congress not too long ago.
Positive attributes of most BDCs include majority floating rate investments. These are inherently less sensitive to changes in interest rates. They have average cash yields above 8%, highly diversified loan pools, and a business model that has now been around for decades.
BDCs are often a “love or hate” sector to many investors. Many see the high dividend and automatically believe they are too risky. I encourage those investors to look at the facts over their feelings. Missing out on this unique asset class for bad reasons isn’t going to help anyone’s retirement. That said, every asset class and strategy has its risks.
The most common explanations for avoiding the sector usually boil down to one or more of these four:
- Poor performance and corporate governance concerns of certain non-traded BDCs;
- Poor performance and corporate governance concerns of certain publicly traded BDCs and their external managers;
- Confusion around the return profile of BDCs in general; and or
- Confusion around what BDCs do and own in their portfolios.
It’s worth remembering that multiple BDCs have outperformed the S&P 500 since their inception. Today’s company, for example, has beaten the S&P 500 index by ~80% since its inception in October 2004.
We authored a series covering these exact topics in the past. For today’s article, we’ll be discussing a top tier BDCs that yielding around 10%. We’ll discuss their performance, corporate governance, and portfolio construction to alleviate those concerns.
I suggest paying special attention to the risks section, as a couple are likely new to you.
Ares Capital (ARCC)
As of the last reporting period, ARCC’s portfolio had a fair value of approximately $21.3 billion. It consisted of 458 portfolio companies backed by 224 different private equity sponsors.
Think of Ares as the lender and another firm, like Carlyle Group (CG) or Blackstone (BX), invested in the company’s equity. Those are what Ares means by “private equity sponsor.”
This makes ARCC the largest publicly traded BDC by market capitalization at around $10 billion. It’s among the most diversified of any BDC and its lending track record is also among the best. Those are reasons why this “heavyweight” BDC is so popular with investors.
The fully covered ~10% yield doesn’t hurt either.
Portfolio Analysis
ARCC reports Q4 earnings pre-market on February 7th, so we’ll mostly be looking at data through September 30, 2022, although we have information through the end of October in some cases. I will provide my estimate and the consensus numbers for Q4 later in the article.
To understand the risks with any investment, one must understand the underlying business. Many focus on headline numbers, usually earnings or growth estimates, but appear to know very little about what drives them. This is one of the most common mistakes I see within the retail investing community, including by authors on Seeking Alpha.
That’s a recipe for disaster, and I’ll explain why. As soon as the company misses estimates, the stock will likely sell off. And those that don’t understand the business? Frozen. How will you know if the lower stock price is a great deal? Or if the business is crumbling and you should sell? Without a keen understanding of the business, you won’t.
And it’s why we usually start with the portfolio. This is what the company owns. In the case of REITs, MLPs, and BDCs, that’s where cash flow – and problems – come from.
A good first step for BDC portfolio analysis is individual company concentrations.
ARCC Q3 Presentation 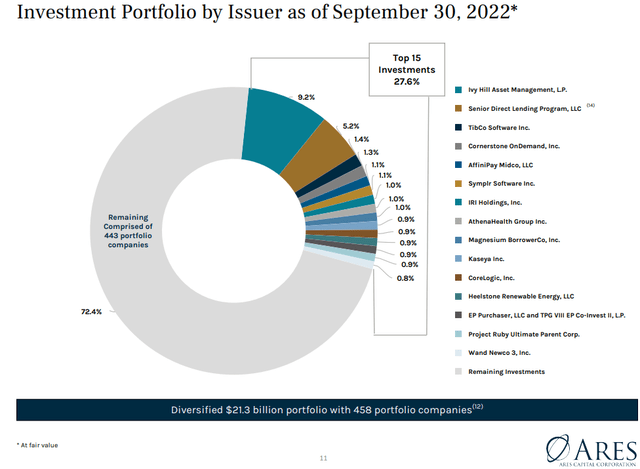
Thanks to ARCC’s giant scale, the top 15 investments represent less than 30% of the total portfolio. You may have noticed Ivy Hill Asset Management is by far the largest holding. That’s because Ivy Hill is a different business compared to the others.
It’s an asset manager with over 20 investment vehicles of its own. In other words, Ivy Hill’s success isn’t tied to a single business. Instead, it’s connected to dozens of different investment strategies. If we were to slice up Ivy Hill by each of its underlying businesses, each one would be a very small (<1%) portion of ARCC’s portfolio.
The second matter is industry/asset type diversification. Long-term readers know I am extremely diligent on this subject. Of all variables, BDCs’ smart industry diversifications is why they withstood the pandemic without too much trouble.
ARCC Q3 Presentation 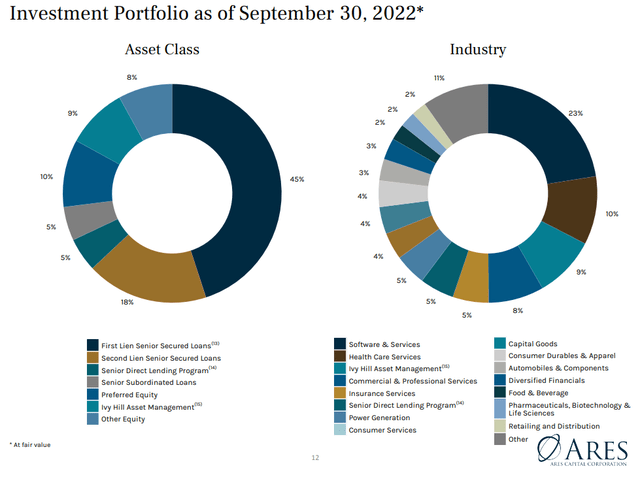
We won’t get too far in the weeds here and will instead focus on the key variables. ARCC’s 45% allocation to first lien senior secured loans is less than most of its top tier BDC peers (e.g., Golub Capital BDC (GBDC) and Owl Rock Capital Corp. (ORCC)). All things equal, first lien loans are the safest loan type.
They also provide the least upside, as you’d expect. Next in the safety hierarchy are second lien senior secured loans at 18% of gross assets. You guessed it, these are the second safest and offer a little more upside than first lien. The Senior Direct Lending Program is a portfolio of senior loans and makes up 5% of total assets.
The rest are subordinate loans or equity and add up to about 32% of total assets. These are higher risk than first and second lien loans but provide much more upside. These asset types are common among BDCs with the best net asset value appreciation. Main Street Capital (MAIN) is the king of that hill and invests a lot in equity.
One type of loan/investment is not “better” than another. To determine that, we must be more nuanced. We’ll touch on this subject later.
Industry diversification is art and science. This is where management’s skill and experience are critical. In ARCC’s case, the largest allocation is 23% to software and services. This broad category encompasses all types of businesses. These are not high-risk start-ups. Instead, they are generally enterprise software companies with steady cash flow and a wide competitive moat.
This industry, coupled with healthcare services, capital goods, and consumer durables and apparel, which make up the top industry exposures, don’t tend to suffer much during recessions. In fact, as you look through the other dozen industries listed in the diagram, none of them are known as highly cyclical. That’s why you don’t see commodities or real estate in the list.
ARCC has excellent industry diversification, which has been the case since I started writing articles on the firm many years ago.
Let’s take a quick look at key trends.
Key Trends
ARCC Q3 Presentation 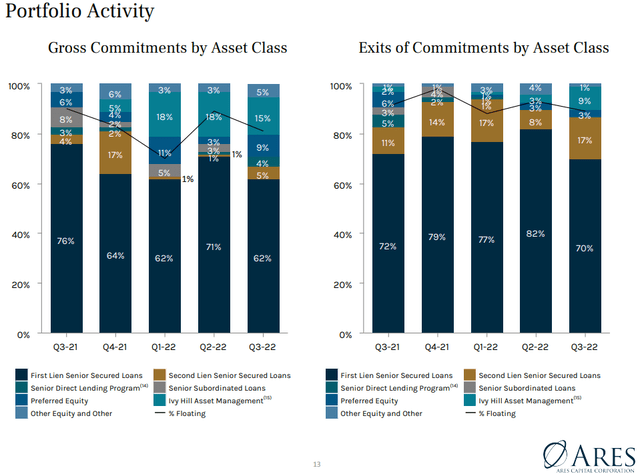
ARCC is tilting the portfolio toward first lien loans. We can discern that because the percentage of new loans in this category is higher than the current portfolio average.
Note that they’ve been 62-76% of new loans since Q3 of 2021. This would be even higher if it weren’t for large commitments made to Ivy Hill since Q1 of 2022.
The rotation to first lien loans would be more dramatic if it weren’t for most of the maturing loans also falling into that category. You can see that in the chart to the right with 70-82% of maturing loans classified as first lien.
BDC portfolios are more like a river than a lake. If incoming deal flow slows, the river starts to run dry quickly.
ARCC Q3 Presentation 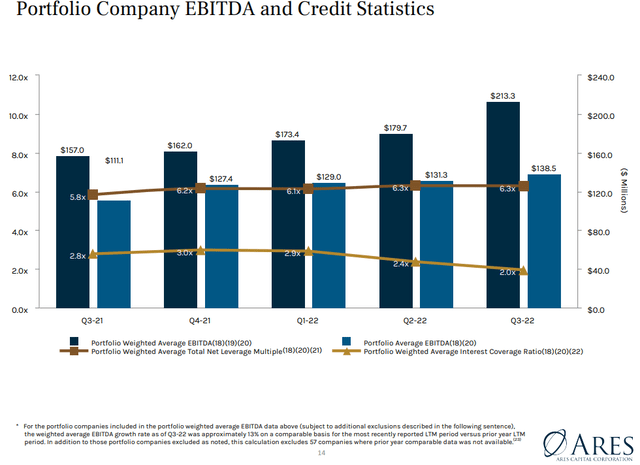
There are two positives, one neutral, and one negative aspect contained in this chart. On the plus side, ARCC’s portfolio companies are generating more EBTIDA than ever. That’s the case whether you use the weighted or simple average. The portfolio companies saw 13% last-twelve-month (“LTM”) EBTIDA growth, which is a strong figure. Management talked a lot about this on the conference call.
The neutral takeaway is that the portfolio companies’ weighted average net leverage multiple has stayed at 6.3x. This is normal and not good or bad.
Lastly, interest rate coverage at the portfolio company level is considerably worse than it was two years ago. But if those same companies are making more money, what’s going on?
Remember that BDCs make floating rate loans to their portfolio company borrowers. It’s a result of that, as I’ll explain.
NY Federal Reserve 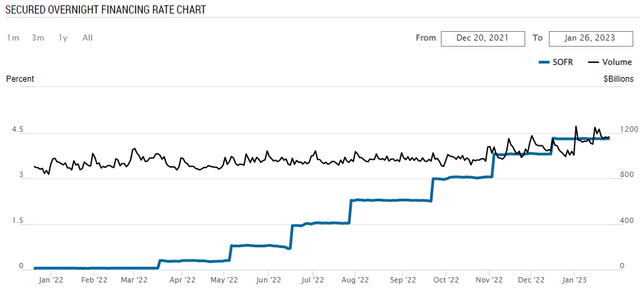
This is a chart of SOFR. I won’t get into the mechanics. All you need to know is this is the rate that most of those floating rate loans are based on. When you see SOFR+ 450 or LIBOR+ 450, that means it’s whatever the SOFR/LIBOR rate is plus 4.50%.
4.50% is where SOFR is currently. It was near zero in early 2022. Now you understand why those portfolio companies’ interest rate coverage has declined from 3.0x to 2.0x, and despite better EBITDA generation. They are paying a lot more in interest.
Fortunately, every penny goes to ARCC.
A good rule of thumb is below 2.0x interest coverage is the “danger zone”. To be clear, unlike normal corporate bonds, there are massive penalties for these firms if they default on their loan obligations to ARCC. These loans are what’s called covenant heavy as opposed to normal corporate bonds, which are called covenant lite.
Covenants are part of legal contracts that give the lender authority over the borrower. Most BDC loans allow the lender to restrict cash from exiting the company when certain triggers are met. They often have the power to fire the existing executives and replace them with their hand-picked management team to right the ship.
This is a major driver of Ares’ extremely favorable loan loss ratios. Thanks to all those protections in the form of covenants, ARCC rarely loses money – even when the loan goes on non-accrual. ARCC’s portfolio has experienced lower loan losses than most investment grade bond indices. That is an eye-opening statistic for those that understand it.
These are among many of the reasons borrowers do not want to default with a BDC lender. That said, we know there is an increase in the risk of non-payment if ARCC’s portfolio companies are stretched too thin. Right now, things are “okay”, but that can change if rates keep going up and the companies’ earnings don’t (as of now, portfolio company earnings have been increasing at a double-digit annual pace).
Cash Flow & Distribution
Q3’s $0.50 in earnings is 9% higher than Q2. Interest rates continued to rise, creating a positive net contribution. Per management, core earnings per share would have been 8% higher if the rate environment applicable to the end of Q3 was in place for all three months. These high single-digit figures may not seem like much, but they truly add up over time.
This means Q4’s core EPS has 8-10% growth “baked in”, all other things equal. Any surprises notwithstanding, I am confident core EPS will fall in the range of $0.56-$0.59 per share.
Management is cognizant of the increase in earnings power and increased the base distribution 12% from $0.43 to $0.48 per share.
ARCC Q3 Presentation 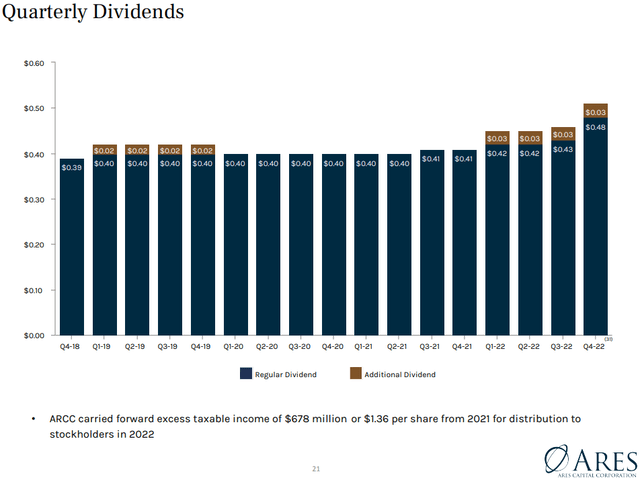
As you can see, the regular dividend was never cut during the pandemic. The recent 12% increase is the largest in many years and a testament to the increased earnings power of BDCs during a rising rate environment.
In terms of distribution coverage, it currently stands at a healthy 1.125x or an 88.9% payout ratio. Anything below 90% for BDCs is considered conservative as they pay out all excess cash flow. That’s very different compared to REITs and MLPs, as they own hard assets that require maintenance and occasionally CapEx.
It’s also important to remember those ratios do not include realized net gains. Good BDCs, like ARCC, tend to generate realized gains over time as well (ARCC has historically generated 1% of NAV in net realized gains every year). While we don’t usually include them in distribution coverage since they are irregular, they do count as profits that can help fund the distribution.
Risk & Balance Sheet
ARCC Q3 Presentation 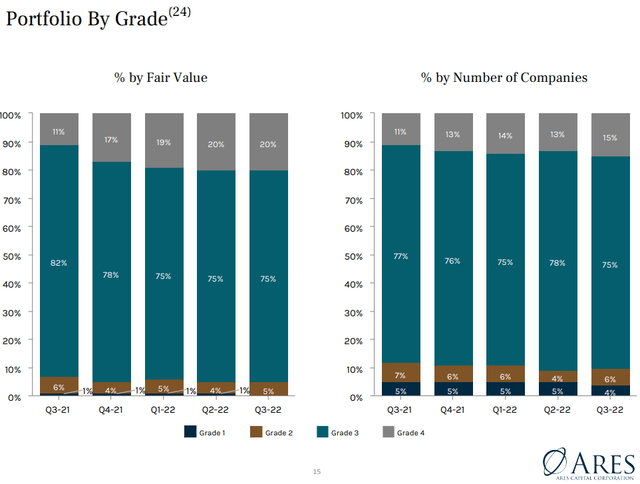
Grades are assigned by management, and we shouldn’t forget that. At the same time, Ares has historically assigned accurate ratings, and we shouldn’t forget that either. Grade 4 is the lowest risk. Grade 3 is the typical rating and indicates the portfolio company is performing in line with expectations at the time the loan was made.
Note that 90% of ARCC’s borrowers and 95% of its assets fall into two lowest risk categories. Grade 2 signals potential problems with the company’s performance but no changes to how ARCC is getting paid.
That was 6% of the portfolio in Q3. Lastly, Grade 1 landed at 4% and indicates a material problem with the portfolio company. That doesn’t necessarily mean the company isn’t paying ARCC, but it signals a high risk that it could occur.
In practice, what usually happens is troubled companies “slide” down the grading scale. That’s why trends associated with companies that go from Grade 3 to 2 to 1 is important. In ARCC’s case, it has been exceedingly consistent. Note that Q3’s overall standing is the best it has been in many quarters.
ARCC Q3 Presentation 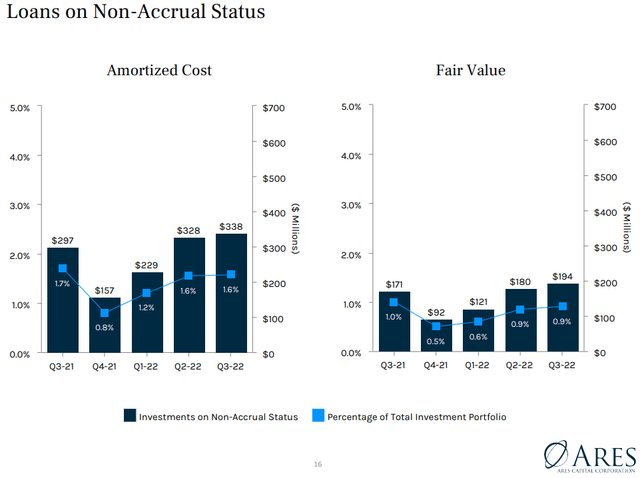
Loans on non-accrual tend to get the most attention, and for good reason. These are non-performing assets in one way or another. We don’t want to put too much emphasis on individual quarterly performance because the real world doesn’t operate in neat 3-month timelines. Instead, we want to focus on the sub-1.0% non-accrual rate based on fair value applicable to most of ARCC’s reporting periods, including the most recent 0.9%.
This doesn’t mean 0.9% of the portfolio is “lost.” It means these loans may have to go through a workout process, and some losses are likely. Historically, Ares manages to recoup ~90% of principal even if the loan goes into default.
That is an extraordinarily powerful metric. We always watch non-accruals carefully, but for now at least, everything is operating as it should.
The last risk I want to mention is the deal pipeline. These are loans ARCC is expecting to make soon to replenish those naturally maturing. In the last earnings release, management stated “as of October 20, 2022, Ares Capital had a backlog and pipeline of approximately $605 million and $0, respectively.”
Why is this a problem?
ARCC exited $418 million in loans (technically commitments) between October 1, 2022 and October 20, 2022 – that’s not even a month. While that’s an unusually high amount, it demonstrates why ARCC needs to constantly replenish its loan pool. The $605 million backlog will keep them busy for a few months, but this is a potential issue.
This is magnified by another recent development. ARCC just issued 10.5 million shares in a secondary offering. Like REITs, share issuances are not a big deal for BDCs. It’s part of the business model. That’s as long as management is smart about it.
The part that raises eyebrows is the fact there doesn’t appear to be a long list of deals that ARCC will use the proceeds from the secondary offering to capitalize on. Given ARCC tends to trade at a premium to net asset value, issuing shares isn’t devastating to shareholders. It’s how these businesses operate.
Executed correctly, and these equity raises are actually accretive to shareholders over the medium and long-term.
ARCC Q3 Debt Presentation 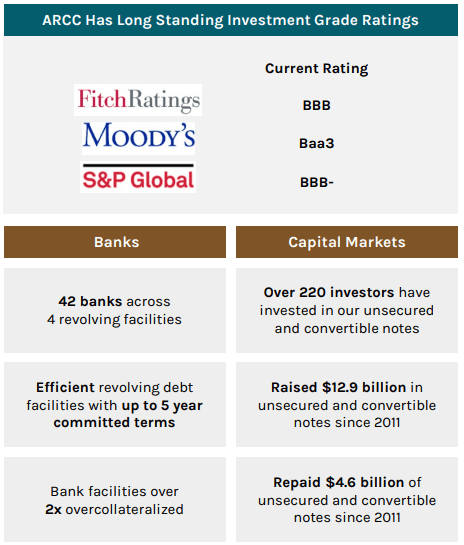
ARCC is one of few BDCs with an investment grade credit rating from all three major rating agencies. This helps keep its cost of capital low and margins high. Despite rapid rise in interest rates, ARCC enjoys a weighted average cost of debt of 4.11%. It’s an even lower 3.81% on principal outstanding (the difference is that ARCC hasn’t drawn down all the available capital in all its facilities, which count in the first metric).
Its current leverage profile is 1.24x, which is at the very upper end of the 0.9x to 1.25x target range. ~1.25x is nothing unusual or problematic for a high quality BDC, but we have likely determined the reason for the recent equity raise: reduce its leverage multiple.
With everyone and their gardener assuming a recession is hitting at any moment, it makes sense that ARCC wants a larger safety cushion. It cannot risk being downgraded and losing its investment grade status.
Conclusion & Valuation
ARCC has 87% floating rate income producing securities in its portfolio. Simultaneously, 72% of ARCC’s debt is fixed rate.
ARCC Q3 Presentation 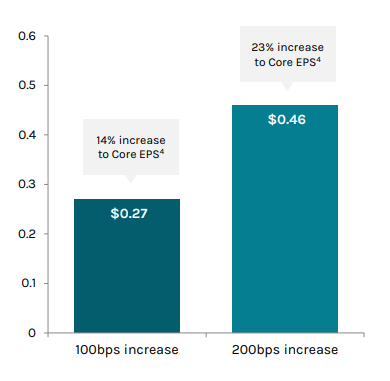
What does this mean?
All other things equal, when rates rise, so will ARCC’s ability to pay larger cash distributions. And given the 12% raise we talked about previously, that is exactly what we’ve seen occur.
A 200-basis point (2%) increase in base rates from Q3’s levels nearly doubles ARCC’s cash earnings. Some of that move has already occurred.
ARCC Q3 Presentation 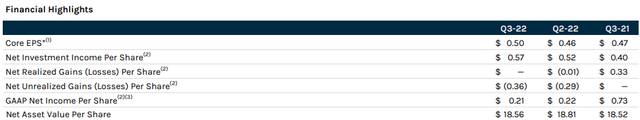
Core EPS, ARCC’s non-GAAP measure of recurring cash flow, is at cyclical highs and will gain another ~10% in the coming 1-2 quarters. Net Asset Value (“NAV”) per share, which is the intrinsic value of the company, has been stable in the mid $18 per share range.
These are powerful tailwinds, especially with ARCC trading at $19.30 per share, or a modest 4% premium to NAV. Historically, picking up shares at a 10% premium or below resulted in a near 100% success rate of a double-digit return over the next 18 months. ARCC has generated a 12% annualized return since inception, which is greater than the S&P 500 over the same period (late 2004 through October of 2022).
On the risk side, we want to watch the pipeline carefully and make sure that when ARCC does have excess capital to invest, that it’s ready (we are not there today). In addition, portfolio company interest coverage ratios are coming under stress due to higher rates.
For the time being, that’s nothing but a cash making machine for ARCC and its investors. But if it continues in this direction for too long, portfolio companies will come under pressure.
Overall, ARCC at a sub-10% premium to NAV is a very good buy at today’s levels. I consider it a “Strong Buy” at or below NAV, which is $18.56 per share or about 4% lower than today’s share price. For context, ARCC spent about 5% of the past 12 months trading materially (>5%) below NAV.
FAST Graphs 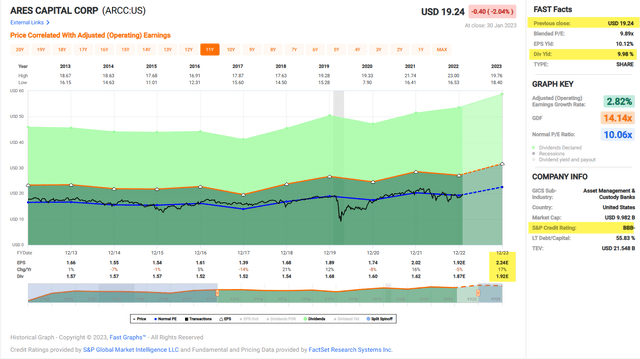
Author’s note: Brad Thomas is a Wall Street writer, which means he’s not always right with his predictions or recommendations. Since that also applies to his grammar, please excuse any typos you may find. Also, this article is free: Written and distributed only to assist in research while providing a forum for second-level thinking.
[ad_2]
Source link

